QUESTION IMAGE
Question
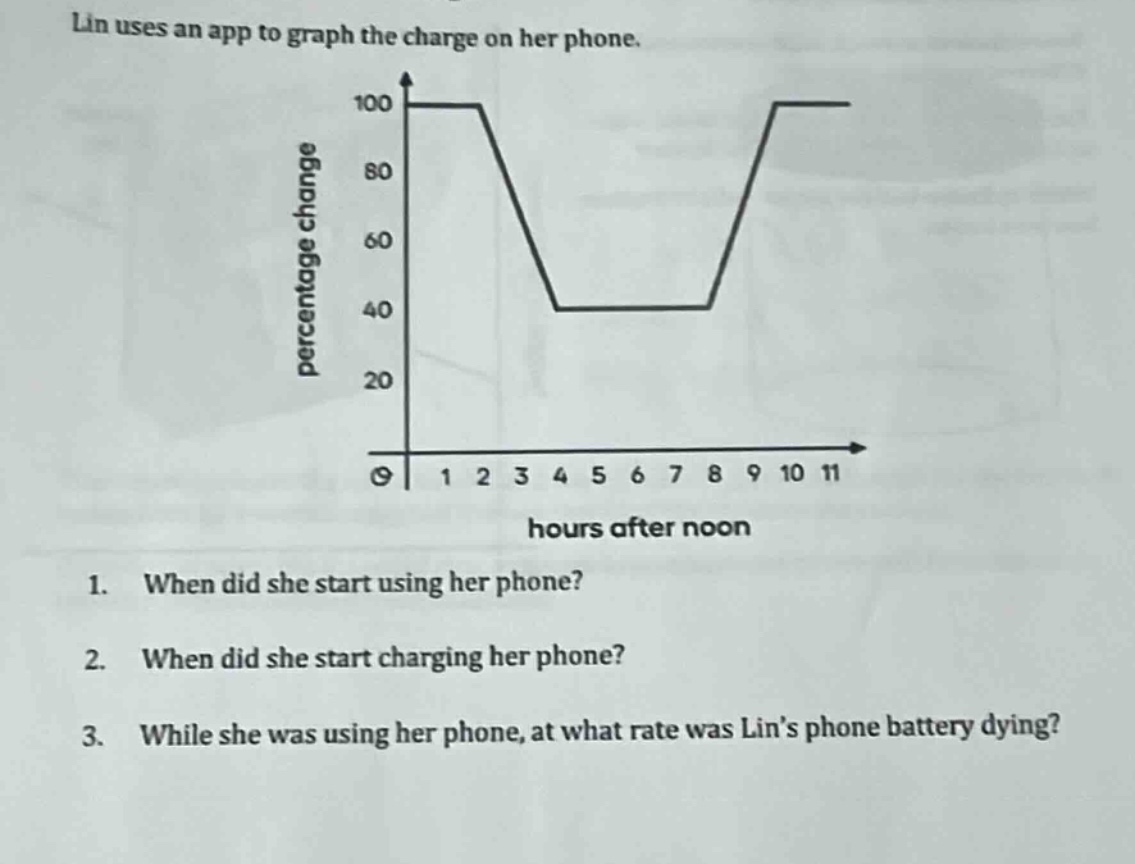
lin uses an app to graph the charge on her phone.
- when did she start using her phone?
- when did she start charging her phone?
- while she was using her phone, at what rate was lin’s phone battery dying?
Sub - question 1:
Step1: Analyze the graph trend
The battery percentage starts to decrease at 2 hours after noon, which means she started using her phone (causing battery to drain) at that time.
Step1: Analyze the graph trend
The battery percentage starts to increase at 8 hours after noon, which means she started charging her phone (causing battery to rise) at that time.
Step1: Identify the time and battery change
From 2 hours after noon to 4 hours after noon, the time elapsed is \(4 - 2=2\) hours. The battery percentage changed from 100% to 40%, so the change in battery percentage is \(100 - 40 = 60\) percentage points.
Step2: Calculate the rate
The rate of battery draining is the change in battery percentage divided by the time elapsed. So the rate \(r=\frac{60}{2}=30\) percentage points per hour.

Snap & solve any problem in the app
Get step-by-step solutions on Sovi AI
Photo-based solutions with guided steps
Explore more problems and detailed explanations
She started using her phone 2 hours after noon (or 2:00 PM).