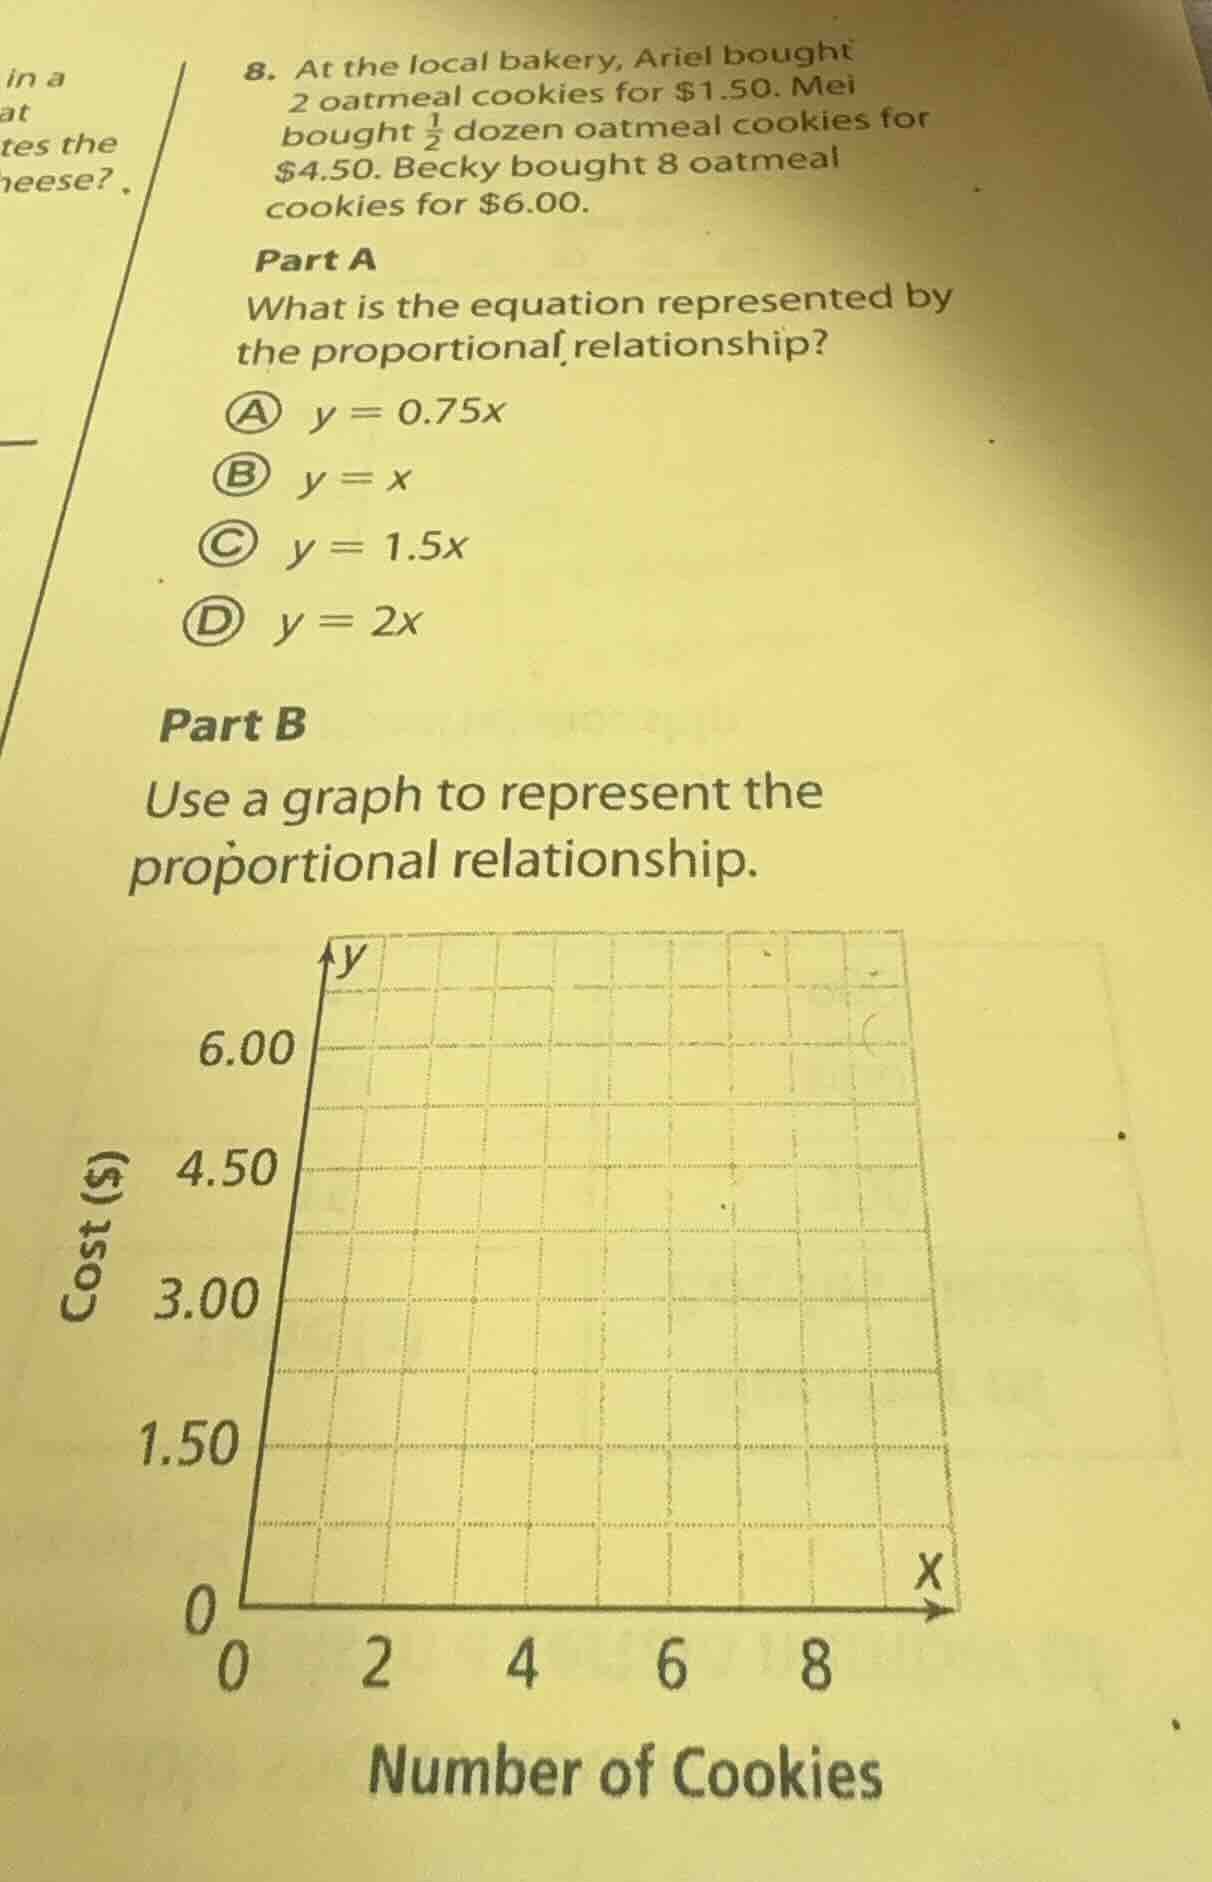
QUESTION IMAGE
Question
- at the local bakery, ariel bought 2 oatmeal cookies for $1.50. mei bought \�LXI0� dozen oatmeal cookies for $4.50. becky bought 8 oatmeal cookies for $6.00.\
part a\
what is the equation represented by the proportional relationship?\
\\(\boldsymbol{\textcircled{a}}\\) \\(y = 0.75x\\)\
\\(\boldsymbol{\textcircled{b}}\\) \\(y = x\\)\
\\(\boldsymbol{\textcircled{c}}\\) \\(y = 1.5x\\)\
\\(\boldsymbol{\textcircled{d}}\\) \\(y = 2x\\)\
part b\
use a graph to represent the proportional relationship.\
\\(\boldsymbol{\text{cost ($)}}\\)\
\\(\boldsymbol{\text{}}\\) 6.00\
\\(\boldsymbol{\text{}}\\) 4.50\
\\(\boldsymbol{\text{}}\\) 3.00\
\\(\boldsymbol{\text{}}\\) 1.50\
\\(\boldsymbol{\text{}}\\) 0\
\\(\boldsymbol{\text{}}\\) 0 2 4 6 8\\(\boldsymbol{\text{number of cookies}}\\)
Step1: Find unit cost (Ariel)
Calculate cost per cookie: $\frac{1.50}{2} = 0.75$
Step2: Verify unit cost (Mei)
$\frac{1}{2}$ dozen = 6 cookies. $\frac{4.50}{6} = 0.75$
Step3: Verify unit cost (Becky)
$\frac{6.00}{8} = 0.75$
Step4: Form proportional equation
Proportional relationship: $y = kx$, where $k=0.75$. So $y=0.75x$
Step5: Identify graph points
Use $(0,0)$, $(2,1.50)$, $(6,4.50)$, $(8,6.00)$

Snap & solve any problem in the app
Get step-by-step solutions on Sovi AI
Photo-based solutions with guided steps
Explore more problems and detailed explanations
Part A:
A. $y = 0.75x$
Part B:
To graph the relationship:
- Plot the points $(0, 0)$, $(2, 1.50)$, $(6, 4.50)$, and $(8, 6.00)$ on the provided grid (x = number of cookies, y = cost in dollars).
- Draw a straight line passing through all these points, starting at the origin $(0,0)$ and extending through the plotted points.