QUESTION IMAGE
Question
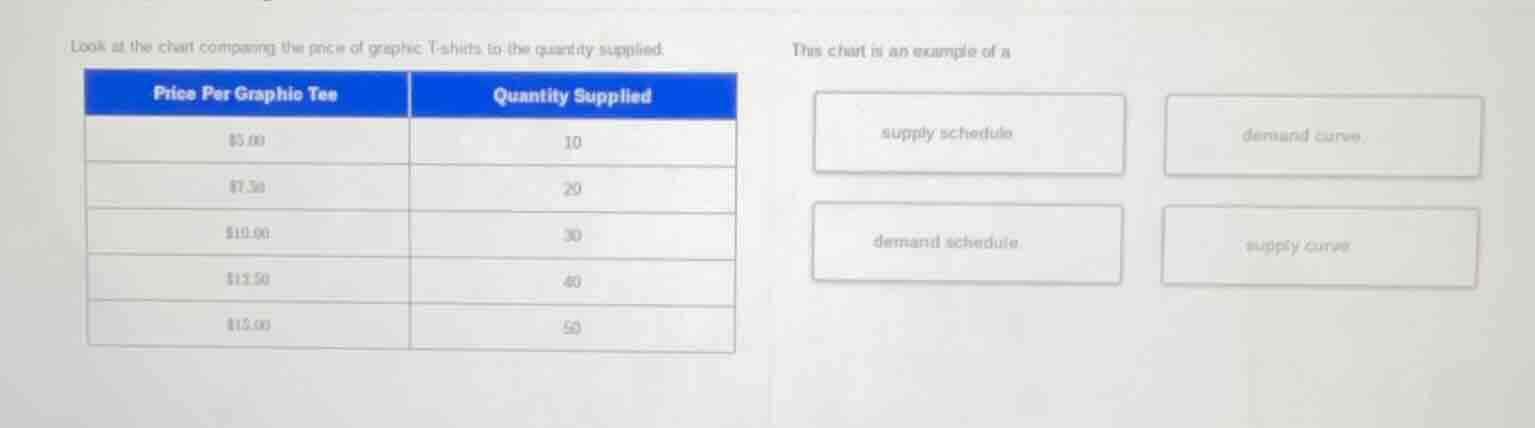
look at the chart comparing the price of graphic t-shirts to the quantity supplied.
price per graphic tee | quantity supplied
$5.00 | 10
$7.50 | 20
$10.00 | 30
$12.50 | 40
$15.00 | 50
this chart is an example of a
supply schedule
demand curve
demand schedule
supply curve
Brief Explanations
A supply schedule is a table that lists the quantity of a good supplied at different prices, which matches the given table showing price and quantity supplied of graphic tees. A demand schedule/curve relates to quantity demanded, and a supply curve is a graphical (not tabular) representation.

Snap & solve any problem in the app
Get step-by-step solutions on Sovi AI
Photo-based solutions with guided steps
Explore more problems and detailed explanations
supply schedule