QUESTION IMAGE
Question
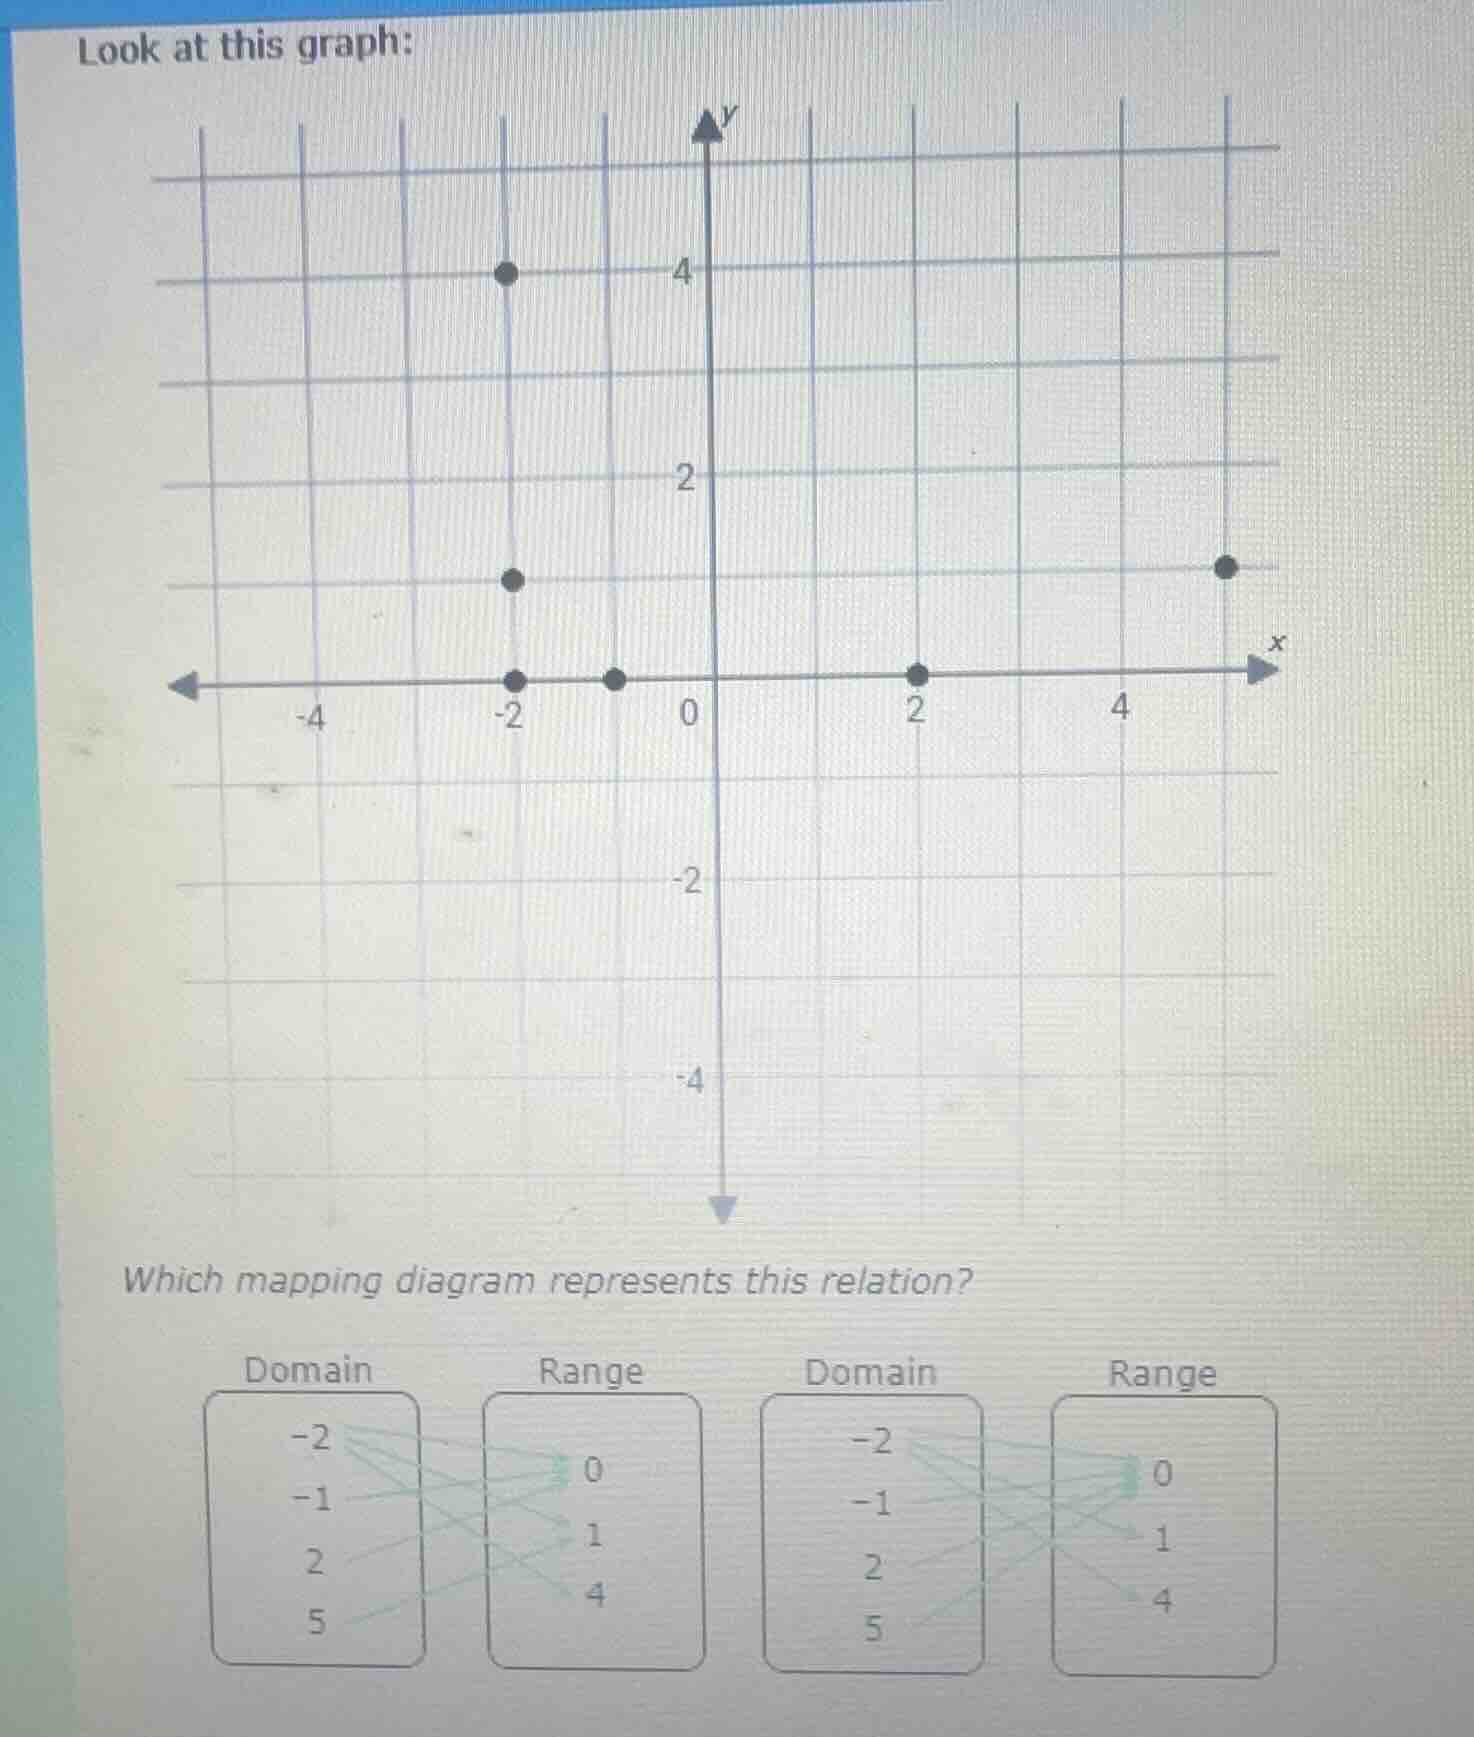
look at this graph:
which mapping diagram represents this relation?
domain
-2
-1
2
5
range
0
1
4
domain
-2
-1
2
5
range
0
1
4
Step1: Identify points on the graph
First, we determine the coordinates of the points from the graph. The points are: \((-2, 4)\), \((-2, 1)\), \((-2, 0)\), \((-1, 0)\), \((2, 0)\), \((5, 1)\). Wait, no, looking at the graph again, the x - coordinates (domain) are \(-2\), \(-1\), \(2\), \(5\)? Wait, no, let's re - examine the graph. The points are at \(x=-2\) (with \(y = 4\), \(y = 1\), \(y = 0\)), \(x=-1\) (with \(y = 0\)), \(x = 2\) (with \(y = 0\)), \(x = 5\) (with \(y = 1\))? Wait, no, the grid: the x - axis has marks at \(-2\), \(-1\), \(0\), \(2\), \(5\)? Wait, the original graph: the black dots are at \((-2,4)\), \((-2,1)\), \((-2,0)\), \((-1,0)\), \((2,0)\), \((5,1)\)? Wait, no, the right - most dot is at \(x = 5\) (assuming the grid lines: let's list the coordinates properly. From the graph, the points are:
- \(x=-2\): \(y = 4\), \(y = 1\), \(y = 0\)
- \(x=-1\): \(y = 0\)
- \(x = 2\): \(y = 0\)
- \(x = 5\): \(y = 1\)
So the domain (x - values) are \(-2\), \(-1\), \(2\), \(5\) and the range (y - values) are \(0\), \(1\), \(4\).
Now, let's check the mapping diagrams. The first mapping diagram has domain \(-2\), \(-1\), \(2\), \(5\) and range \(0\), \(1\), \(4\). Let's check the mappings:
- \(-2\) maps to \(0\), \(1\), \(4\) (since at \(x=-2\), \(y = 0\), \(y = 1\), \(y = 4\))
- \(-1\) maps to \(0\) (since at \(x=-1\), \(y = 0\))
- \(2\) maps to \(0\) (since at \(x = 2\), \(y = 0\))
- \(5\) maps to \(1\) (since at \(x = 5\), \(y = 1\))
Now check the second mapping diagram. Wait, the user's diagram: the first domain is \(-2\), \(-1\), \(2\), \(5\) and range \(0\), \(1\), \(4\). The second domain is also \(-2\), \(-1\), \(2\), \(5\) and range \(0\), \(1\), \(4\). Wait, maybe I misread the coordinates. Wait, the graph: the x - coordinates of the points are \(-2\) (three points: \(y = 4\), \(y = 1\), \(y = 0\)), \(x=-1\) (one point: \(y = 0\)), \(x = 2\) (one point: \(y = 0\)), \(x = 5\) (one point: \(y = 1\)).
So domain elements: \(-2\), \(-1\), \(2\), \(5\)
Range elements: \(0\), \(1\), \(4\)
Now, for the mapping:
- \(-2\) should map to \(0\), \(1\), \(4\)
- \(-1\) should map to \(0\)
- \(2\) should map to \(0\)
- \(5\) should map to \(1\)
Looking at the first mapping diagram (left one):
- \(-2\) has arrows to \(0\), \(1\), \(4\)
- \(-1\) has an arrow to \(0\)
- \(2\) has an arrow to \(0\)
- \(5\) has an arrow to \(1\)
The second mapping diagram: Let's assume the second one has different mappings. Wait, maybe the x - coordinate of the right - most point is \(5\)? Wait, maybe I made a mistake. Wait, the original graph: the right - most dot is at \(x = 5\)? Or is it \(x = 5\) or \(x = 4\)? Wait, the grid lines: the x - axis has marks at \(-4\), \(-2\), \(-1\), \(0\), \(2\), \(4\), \(5\)? No, the grid lines are probably at integer values. Let's re - express the coordinates correctly.
Looking at the graph:
- The point at \(x=-2\): \(y = 4\) (top), \(y = 1\) (middle), \(y = 0\) (bottom)
- The point at \(x=-1\): \(y = 0\)
- The point at \(x = 2\): \(y = 0\)
- The point at \(x = 5\): \(y = 1\) (assuming the right - most dot is at \(x = 5\))
So domain: \(\{-2,-1,2,5\}\), range: \(\{0,1,4\}\)
Now, the first mapping diagram (left) has domain \(-2\), \(-1\), \(2\), \(5\) and range \(0\), \(1\), \(4\) with the correct mappings:
- \(-2\) maps to \(0\), \(1\), \(4\)
- \(-1\) maps to \(0\)
- \(2\) maps to \(0\)
- \(5\) maps to \(1\)
The second mapping diagram (right) probably has incorrect mappings. So the correct mapping diagram is the first one (the left - hand side mapping diagram with domain \(-2\), \(-1\), \(2\), \(5\) and ra…

Snap & solve any problem in the app
Get step-by-step solutions on Sovi AI
Photo-based solutions with guided steps
Explore more problems and detailed explanations
The mapping diagram with Domain \(\{-2,-1,2,5\}\) and Range \(\{0,1,4\}\) where \(-2\) maps to \(0\), \(1\), \(4\); \(-1\) maps to \(0\); \(2\) maps to \(0\); \(5\) maps to \(1\) (the left - hand mapping diagram among the two provided).