QUESTION IMAGE
Question
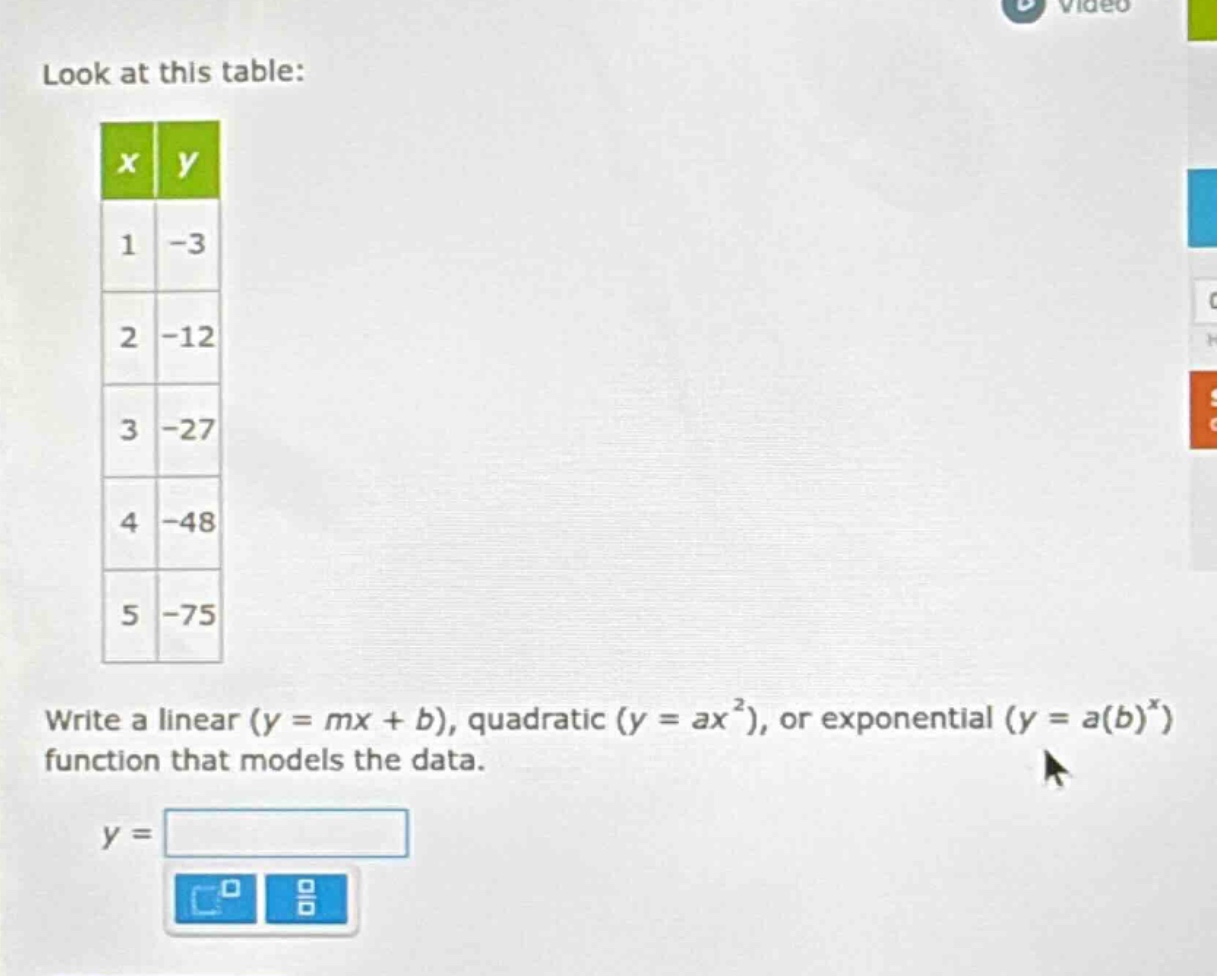
look at this table:
| x | y |
| 1 | -3 |
| 2 | -12 |
| 3 | -27 |
| 4 | -48 |
| 5 | -75 |
write a linear ($y = mx + b$), quadratic ($y = ax^2$), or exponential ($y = a(b)^x$) function that models the data.
$y = \square$
Step1: Test linear model (constant slope)
Slope between (1,-3) & (2,-12): $\frac{-12 - (-3)}{2-1} = -9$
Slope between (2,-12) & (3,-27): $\frac{-27 - (-12)}{3-2} = -15$
Slopes are not equal, so not linear.
Step2: Test quadratic model ($y=ax^2$)
Plug in $x=1, y=-3$:
$-3 = a(1)^2 \implies a = -3$
Step3: Verify quadratic fit
For $x=2$: $y=-3(2)^2 = -12$ (matches table)
For $x=3$: $y=-3(3)^2 = -27$ (matches table)
For $x=4$: $y=-3(4)^2 = -48$ (matches table)
For $x=5$: $y=-3(5)^2 = -75$ (matches table)
Step4: Test exponential model (constant ratio)
Ratio between (2,-12) & (1,-3): $\frac{-12}{-3}=4$
Ratio between (3,-27) & (2,-12): $\frac{-27}{-12}=2.25$
Ratios are not equal, so not exponential.

Snap & solve any problem in the app
Get step-by-step solutions on Sovi AI
Photo-based solutions with guided steps
Explore more problems and detailed explanations
$y = -3x^2$