QUESTION IMAGE
Question
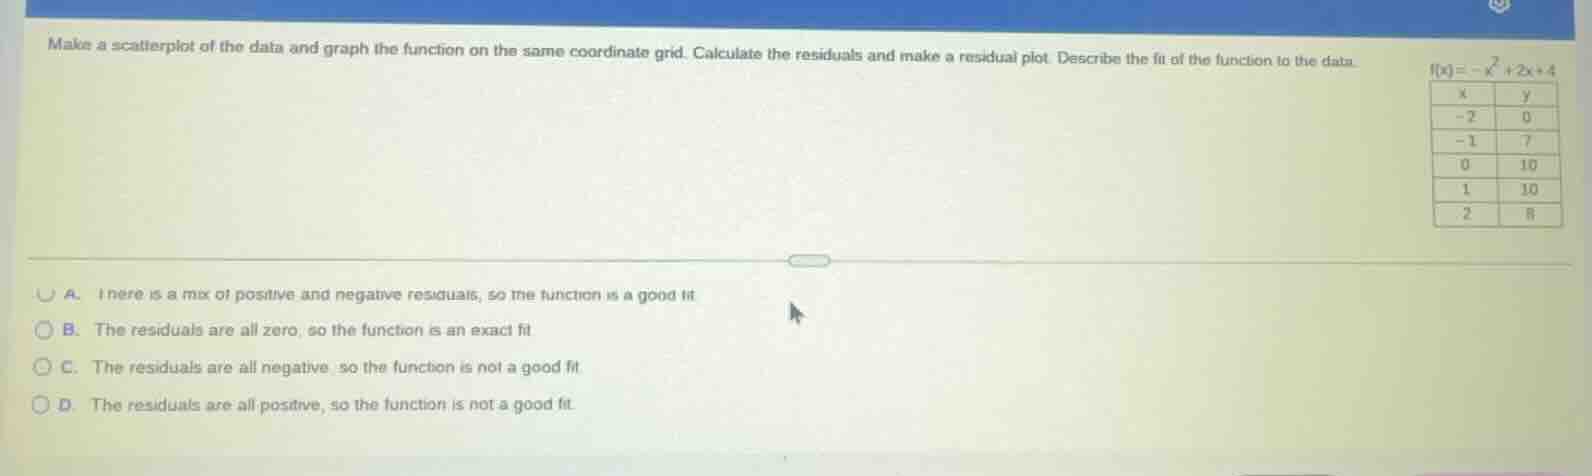
make a scatterplot of the data and graph the function on the same coordinate grid. calculate the residuals and make a residual plot. describe the fit of the function to the data.
$f(x) = -x^2 + 2x + 4$
| x | y |
| -2 | 0 |
| -1 | 7 |
| 0 | 10 |
| 1 | 10 |
| 2 | 8 |
a. there is a mix of positive and negative residuals, so the function is a good fit
b. the residuals are all zero, so the function is an exact fit
c. the residuals are all negative, so the function is not a good fit
d. the residuals are all positive, so the function is not a good fit
Step1: Calculate predicted y-values
For each $x$, compute $f(x)=-x^2+2x+4$:
- $x=-2$: $f(-2)=-(-2)^2+2(-2)+4=-4-4+4=-4$
- $x=-1$: $f(-1)=-(-1)^2+2(-1)+4=-1-2+4=1$
- $x=0$: $f(0)=-(0)^2+2(0)+4=4$
- $x=1$: $f(1)=-(1)^2+2(1)+4=-1+2+4=5$
- $x=2$: $f(2)=-(2)^2+2(2)+4=-4+4+4=4$
Step2: Compute residuals (actual - predicted)
Residual formula: $y_{\text{actual}} - f(x)$
- $x=-2$: $0 - (-4)=4$
- $x=-1$: $7 - 1=6$
- $x=0$: $10 - 4=6$
- $x=1$: $10 - 5=5$
- $x=2$: $8 - 4=4$
Step3: Analyze residuals
All residuals are positive, meaning the function consistently underestimates the actual data points, so it is not a good fit.

Snap & solve any problem in the app
Get step-by-step solutions on Sovi AI
Photo-based solutions with guided steps
Explore more problems and detailed explanations
D. The residuals are all positive, so the function is not a good fit.