QUESTION IMAGE
Question
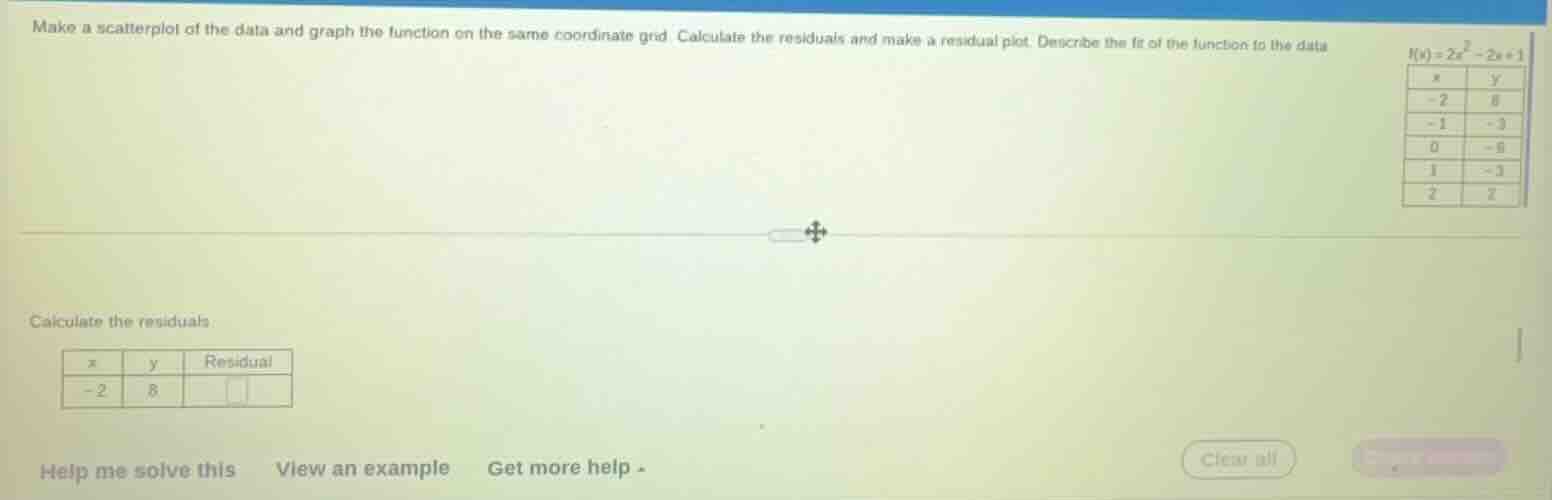
make a scatterplot of the data and graph the function on the same coordinate grid. calculate the residuals and make a residual plot. describe the fit of the function to the data. f(x)=2x² - 2x + 1. the data table has x values -2, -1, 0, 1, 2 and corresponding y values 8, -3, -6, -3, 7. then theres a section to calculate the residuals with a table having x=-2, y=8 and a blank for residual. there are options help me solve this, view an example, get more help -, clear all.
Step1: Define residual formula
Residual = $y - f(x)$
Step2: Calculate $f(-2)$
$f(-2)=2(-2)^2-2(-2)+1=2(4)+4+1=8+4+1=13$
Step3: Find residual for $x=-2$
$8 - 13 = -1$
Step4: Calculate $f(-1)$
$f(-1)=2(-1)^2-2(-1)+1=2(1)+2+1=2+2+1=5$
Step5: Find residual for $x=-1$
$-3 - 5 = 0$
Step6: Calculate $f(0)$
$f(0)=2(0)^2-2(0)+1=0-0+1=1$
Step7: Find residual for $x=0$
$-6 - 1 = -5$
Step8: Calculate $f(1)$
$f(1)=2(1)^2-2(1)+1=2(1)-2+1=2-2+1=1$
Step9: Find residual for $x=1$
$-3 - 1 = 0$
Step10: Calculate $f(2)$
$f(2)=2(2)^2-2(2)+1=2(4)-4+1=8-4+1=5$
Step11: Find residual for $x=2$
$7 - 5 = -2$
Step12: Assess function fit
Residuals have large magnitudes and no random pattern, so the fit is poor.

Snap & solve any problem in the app
Get step-by-step solutions on Sovi AI
Photo-based solutions with guided steps
Explore more problems and detailed explanations
| x | y | Residual |
|---|---|---|
| -1 | -3 | 0 |
| 0 | -6 | -5 |
| 1 | -3 | 0 |
| 2 | 7 | -2 |
The function has a poor fit to the data.