QUESTION IMAGE
Question
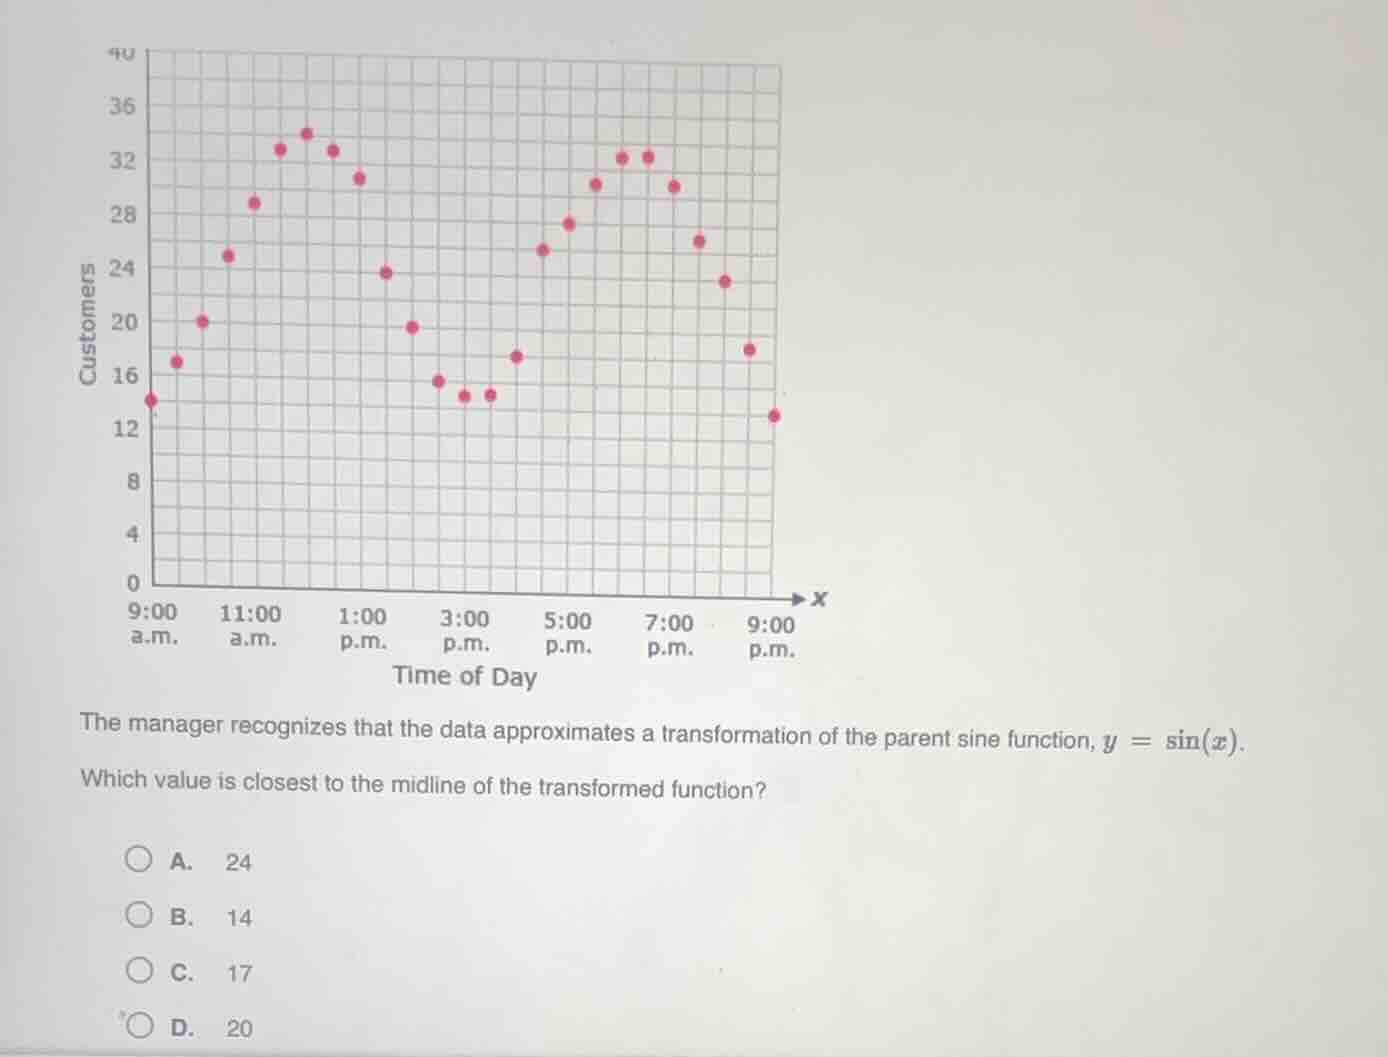
the manager recognizes that the data approximates a transformation of the parent sine function, $y = \sin(x)$. which value is closest to the midline of the transformed function? \\(\bigcirc\\) a. 24 \\(\bigcirc\\) b. 14 \\(\bigcirc\\) c. 17 \\(\bigcirc\\) d. 20
Step1: Recall midline formula
The midline of a sinusoidal function (a transformed sine function here) is the horizontal line that is the average of the maximum and minimum values of the function. So, we need to find the approximate maximum and minimum number of customers from the graph.
Step2: Identify max and min
From the graph, looking at the y - axis (number of customers), the maximum value (highest point) seems to be around 34 (from the data points, the peak is around 32 - 36, let's say approximately 34) and the minimum value (lowest point) seems to be around 14 (the lowest data points are around 12 - 14, let's say approximately 14).
Step3: Calculate midline
The formula for the midline \( M=\frac{\text{Max}+\text{Min}}{2} \). Substituting the values of Max = 34 and Min = 14, we get \( M = \frac{34 + 14}{2}=\frac{48}{2}=24 \)? Wait, no, maybe my estimation of max and min is wrong. Let's re - estimate. Looking at the data points: the highest points are around 34 (maybe 32 - 36) and the lowest points are around 12 - 14. Wait, but let's check the options. Wait, maybe the max is around 34 and min around 10? No, the lowest point is around 12 - 14. Wait, another way: the midline is the average of the maximum and minimum y - values. Let's look at the data points. The highest y - value (customers) seems to be around 34 (from the red dots, the peak in the morning and evening) and the lowest around 14 (the troughs). Wait, but let's calculate \( \frac{34 + 14}{2}=24 \), but option A is 24, but wait, maybe I made a mistake. Wait, let's look at the graph again. The data points: at 9:00 am, it's around 14, then goes up to around 34, then down to around 14, then up again. Wait, no, the first peak is around 12:00 pm (12:00 noon) with around 34, then a trough around 3:00 pm with around 14, then another peak around 7:00 pm with around 34, then a trough around 9:00 pm with around 14. So the midline should be \( \frac{34+14}{2}=24 \)? But wait, let's check the options. Option A is 24, B is 14, C is 17, D is 20. Wait, maybe my max and min are wrong. Let's look at the y - axis. The grid lines: each grid line is, let's see, from 0 to 40, with intervals of 4? Wait, no, the y - axis is labeled 0,4,8,12,16,20,24,28,32,36,40. So each grid square is 4 units? Wait, no, the distance between 12 and 16 is 4, so each small square is 2 units? Wait, maybe the maximum value is around 34 (so 32 - 36) and the minimum is around 14 (12 - 16). Then midline is \( \frac{34 + 14}{2}=24 \). But let's check the options. Option A is 24. Alternatively, maybe the max is 32 and min is 16, then midline is \( \frac{32 + 16}{2}=24 \). Yes, that makes sense. So the midline is around 24.

Snap & solve any problem in the app
Get step-by-step solutions on Sovi AI
Photo-based solutions with guided steps
Explore more problems and detailed explanations
A. 24