QUESTION IMAGE
Question
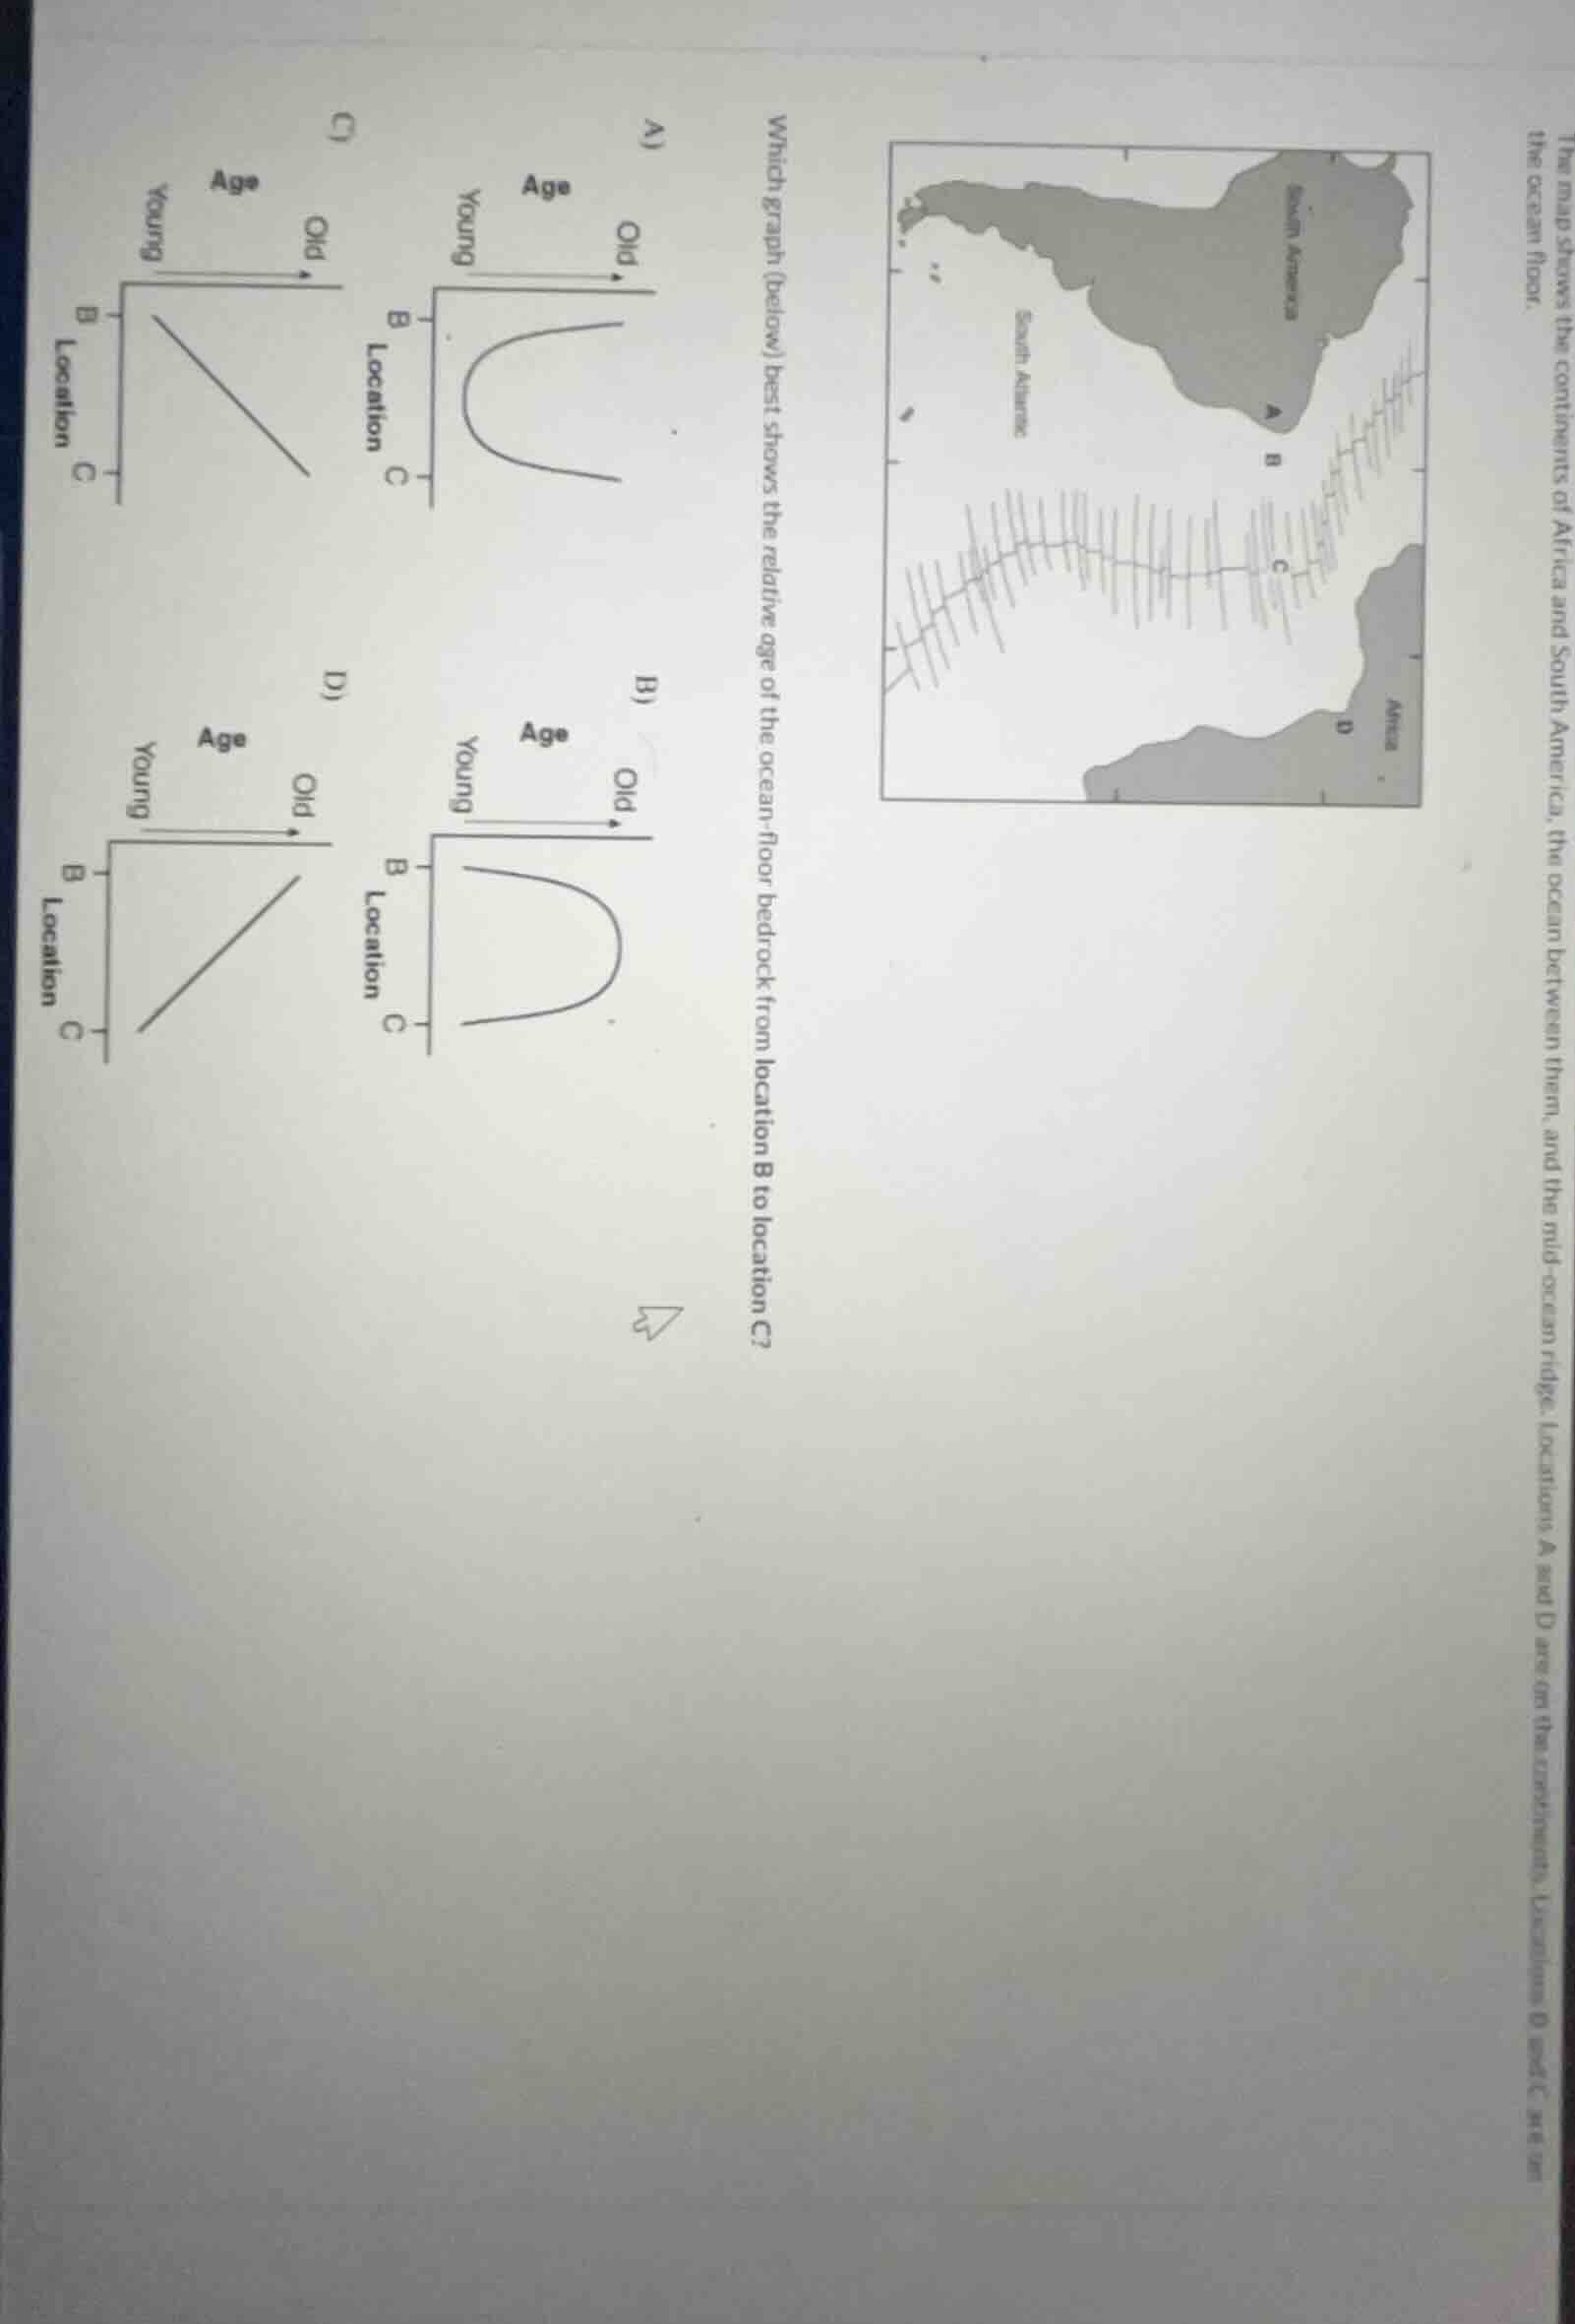
the map shows the continents of africa and south america, the ocean between them, and the mid - ocean ridge. locations a and d are on the continents. locations b and c are on the ocean floor. which graph (below) best shows the relative age of the ocean - floor bedrock from location b to location c? (then four graphs a, b, c, d are shown with age (young to old) on the x - axis and location (b to c) on the y - axis, with different curves or lines in each graph)
Step1: Recall Ocean Floor Age Pattern
The mid - ocean ridge (where new oceanic crust is formed) has the youngest ocean - floor bedrock. As we move away from the mid - ocean ridge (towards the continents), the ocean - floor bedrock gets older. In the given problem, location B is closer to the mid - ocean ridge (younger bedrock) and location C is farther from the mid - ocean ridge (older bedrock). So, as we move from B to C, the age of the ocean - floor bedrock should increase.
Step2: Analyze Each Graph
- Graph A: The curve is a U - shape, which would imply that the age first decreases then increases, which is not consistent with the ocean - floor age pattern.
- Graph B: The curve is an inverted U - shape, which would imply that the age first increases then decreases, which is not consistent with the ocean - floor age pattern.
- Graph C: The line has a positive slope, meaning as we move from B (left) to C (right) on the location axis, the age (on the vertical axis) increases. This is consistent with the fact that as we move away from the mid - ocean ridge (from B to C), the ocean - floor bedrock gets older.
- Graph D: The line has a negative slope, meaning as we move from B to C, the age decreases, which is opposite to the expected pattern.

Snap & solve any problem in the app
Get step-by-step solutions on Sovi AI
Photo-based solutions with guided steps
Explore more problems and detailed explanations
C (the graph with a positive - sloped line from B to C, showing age increasing as location moves from B to C)