QUESTION IMAGE
Question
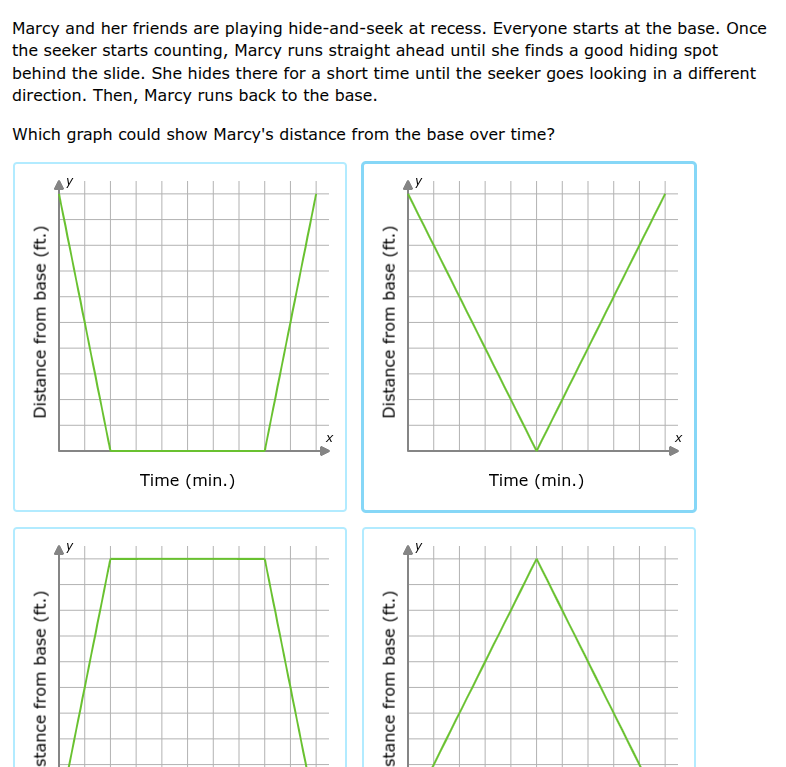
marcy and her friends are playing hide - and - seek at recess. everyone starts at the base. once the seeker starts counting, marcy runs straight ahead until she finds a good hiding spot behind the slide. she hides there for a short time until the seeker goes looking in a different direction. then, marcy runs back to the base. which graph could show marcys distance from the base over time?
Step1: Analyze initial distance
Marcy starts at the base, so initial distance from base is 0. So graphs with non - zero y - intercept (like first two with y - intercept > 0) can be eliminated.
Step2: Analyze motion phases
- Phase 1: Runs straight ahead (distance from base increases with time, so a positive - sloped line).
- Phase 2: Hides (distance from base remains constant, so a horizontal line).
- Phase 3: Runs back to base (distance from base decreases with time, so a negative - sloped line).
The third graph (bottom - left) has: starts at 0 (correct initial distance), first a positive - slope (running away), then a horizontal line (hiding), then a negative - slope (running back). The fourth graph has distance increasing then decreasing but no horizontal (hiding) phase.

Snap & solve any problem in the app
Get step-by-step solutions on Sovi AI
Photo-based solutions with guided steps
Explore more problems and detailed explanations
The third graph (bottom - left one with a positive slope, then horizontal, then negative slope, starting from (0,0))