QUESTION IMAGE
Question
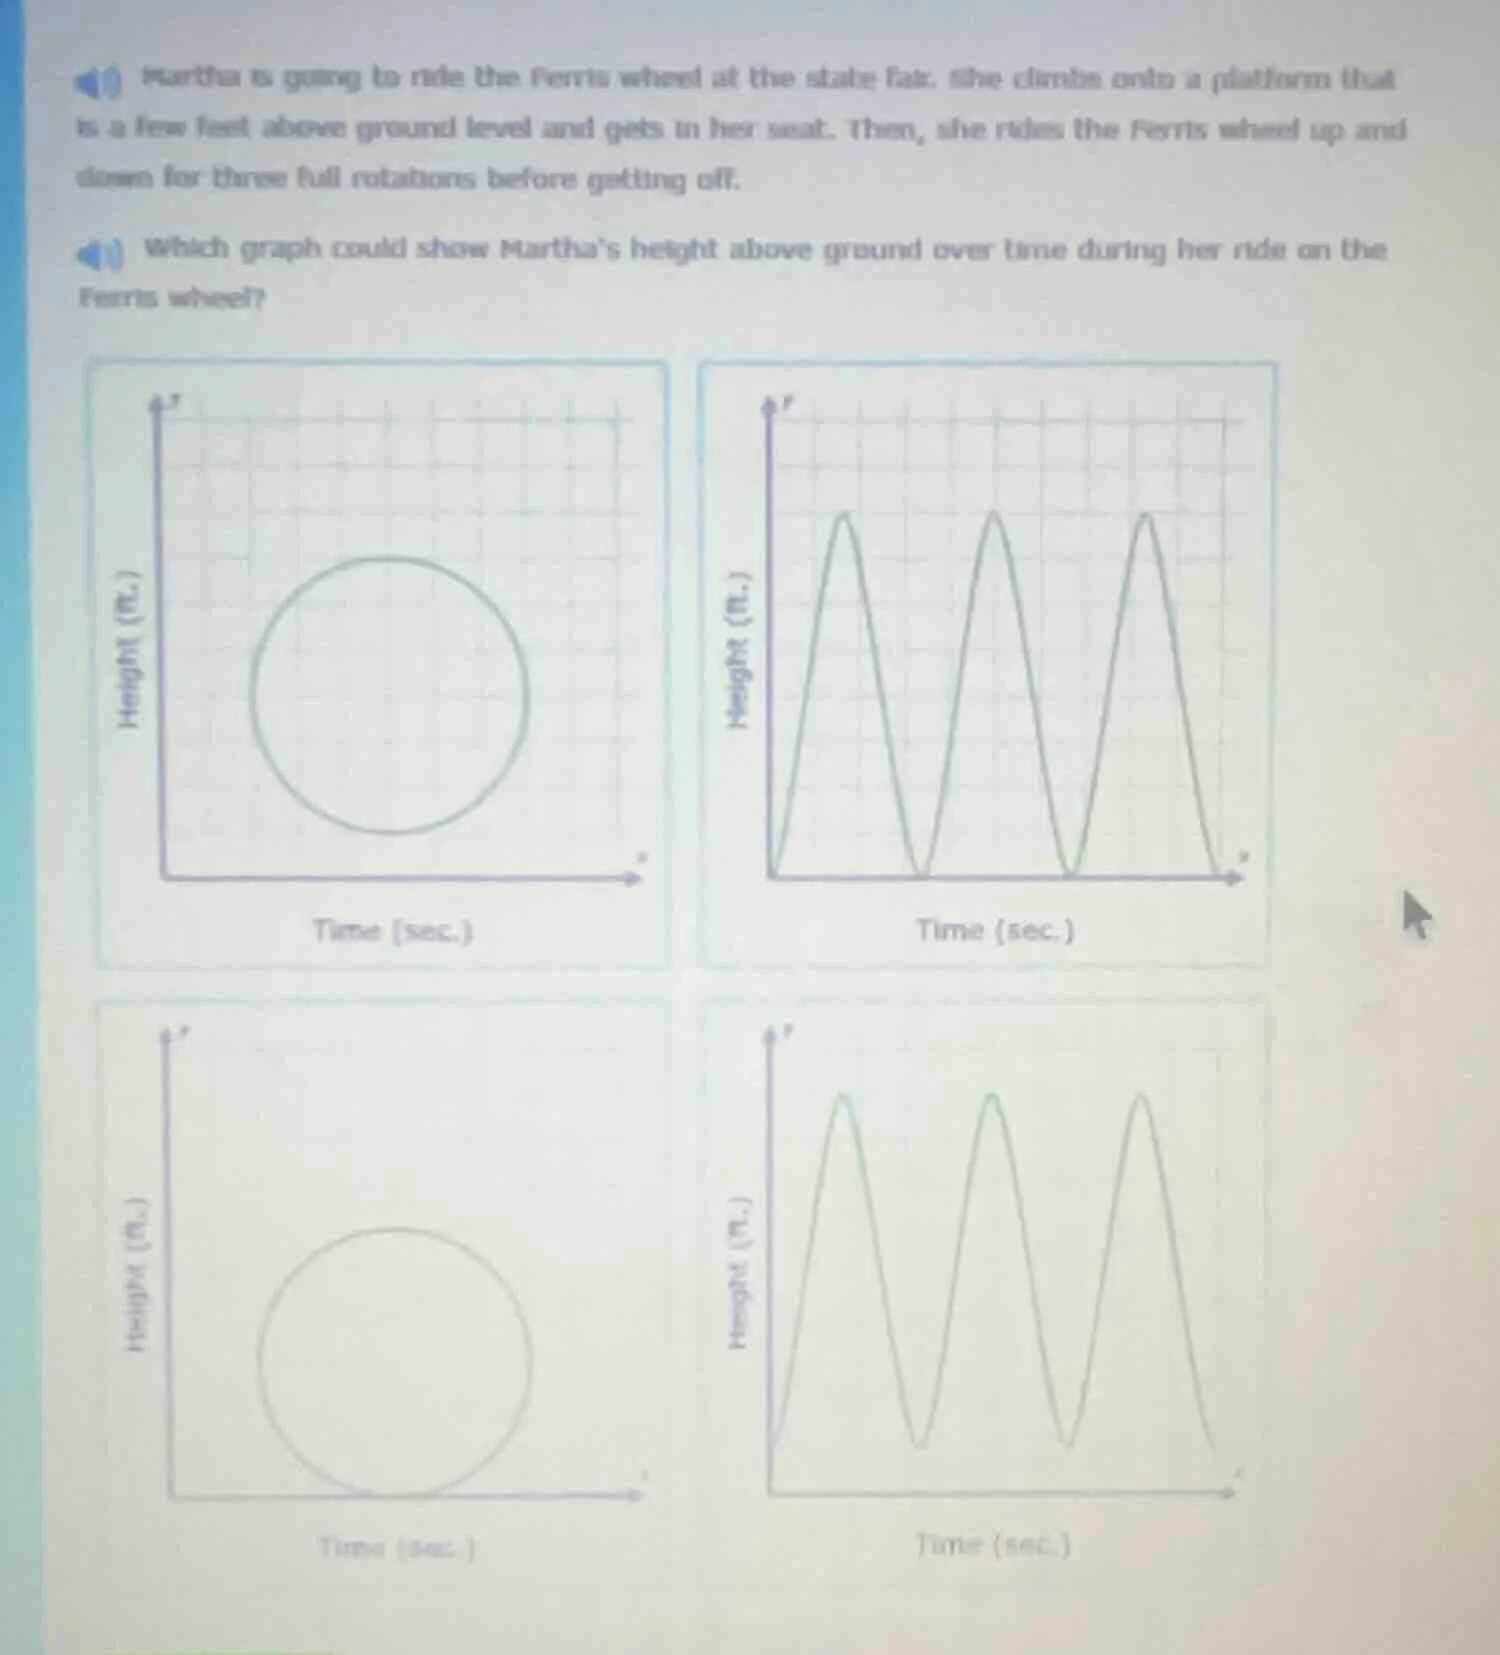
martha is going to ride the ferris wheel at the state fair. she climbs onto a platform that is a few feet above ground level and gets in her seat. then, she rides the ferris wheel up and down for three full rotations before getting off. which graph could show martha’s height above ground over time during her ride on the ferris wheel?
A Ferris wheel's height over time follows a smooth, periodic (sinusoidal) pattern: height increases gradually to a peak, then decreases gradually back to the starting height (above ground, not zero) for each rotation, repeating for 3 full cycles.
- Circle graphs are invalid as time cannot decrease.
- The triangular graph touching zero is wrong because Martha starts above ground and never reaches ground level.
- The bottom-right graph has smooth, non-zero periodic peaks and troughs matching the Ferris wheel's motion.

Snap & solve any problem in the app
Get step-by-step solutions on Sovi AI
Photo-based solutions with guided steps
Explore more problems and detailed explanations
The bottom-right graph (smooth, 3 repeating peaks with troughs above the time axis)