QUESTION IMAGE
Question
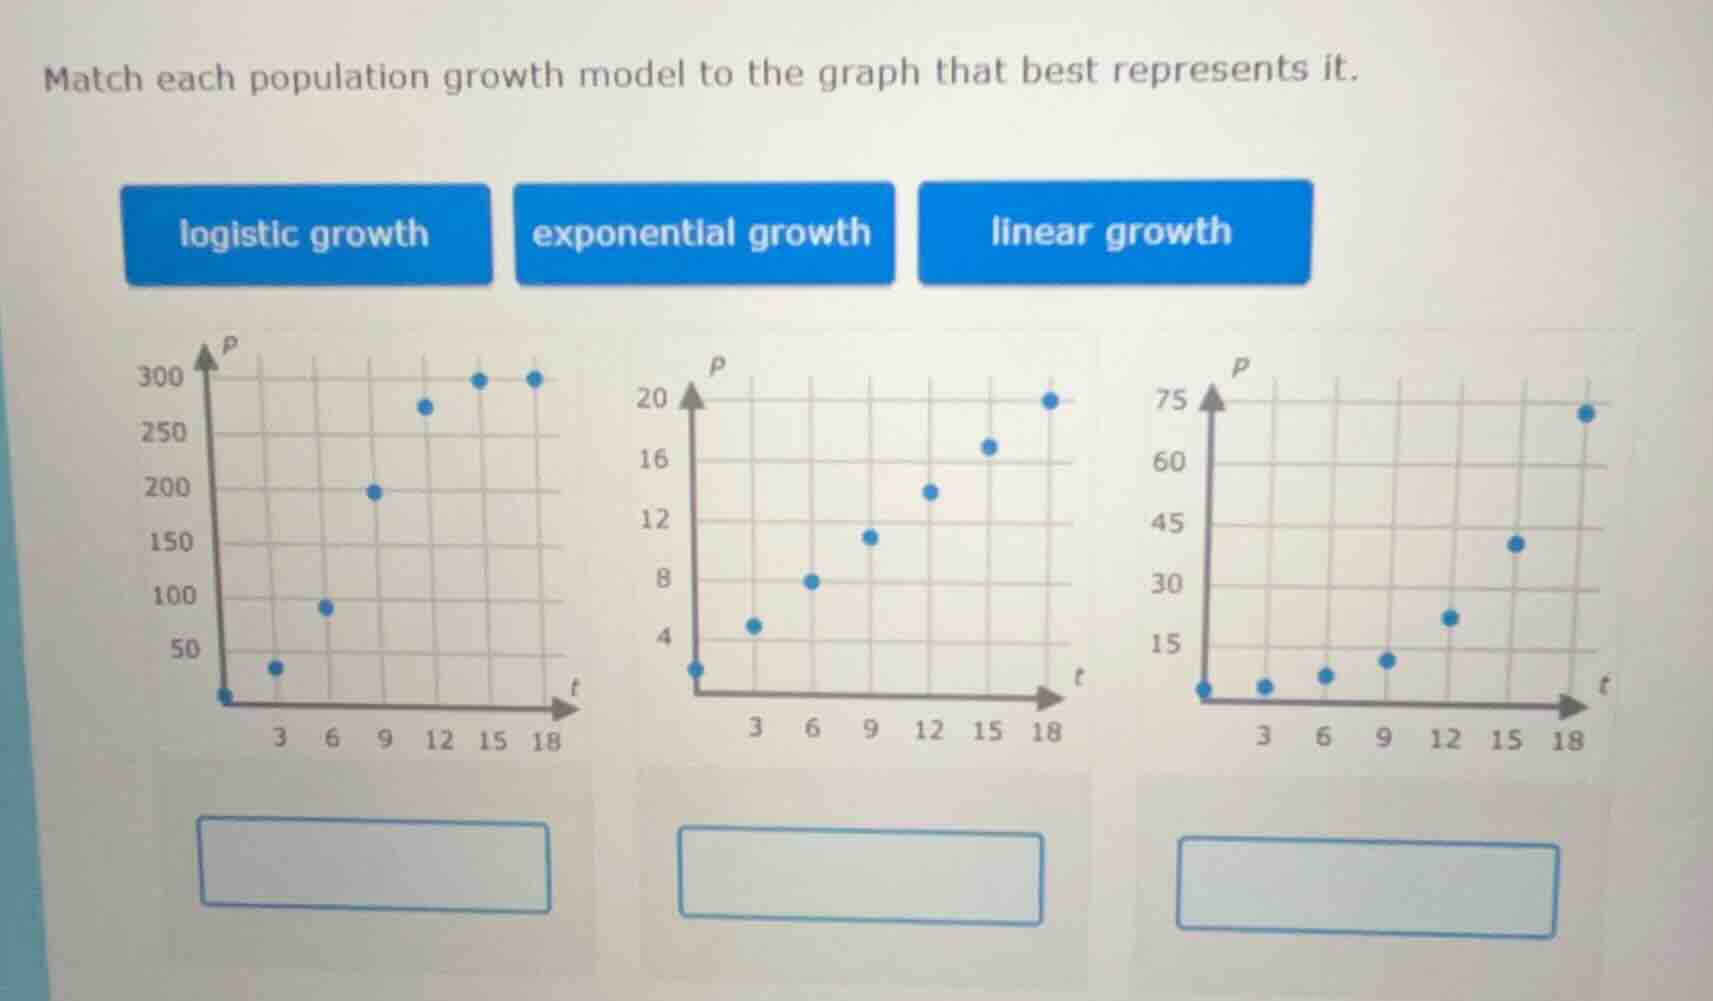
match each population growth model to the graph that best represents it.
logistic growth exponential growth linear growth
Brief Explanations
- First graph (left): The population grows quickly at first, then the growth slows and approaches a maximum value (plateaus), which is the signature S-curve shape of logistic growth, limited by carrying capacity.
- Second graph (middle): The population increases by a multiplicative factor at each interval, with the gap between consecutive points growing larger exponentially, matching exponential growth.
- Third graph (right): The population increases by a constant amount at each time interval, creating a straight-line pattern, which defines linear growth.

Snap & solve any problem in the app
Get step-by-step solutions on Sovi AI
Photo-based solutions with guided steps
Explore more problems and detailed explanations
- Left graph: logistic growth
- Middle graph: exponential growth
- Right graph: linear growth