QUESTION IMAGE
Question
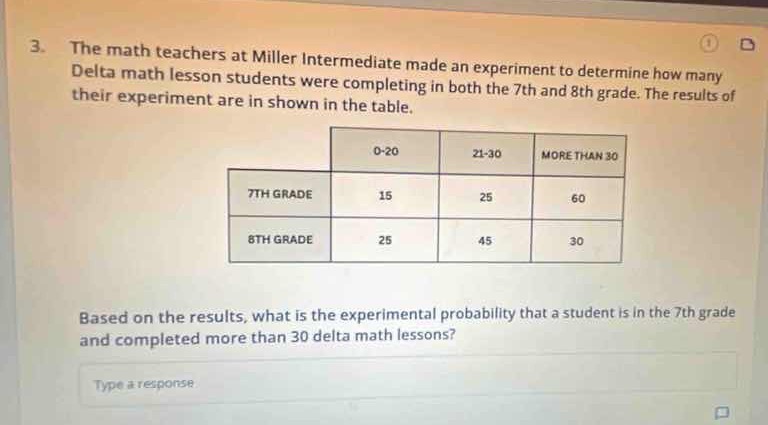
- the math teachers at miller intermediate made an experiment to determine how many delta math lesson students were completing in both the 7th and 8th grade. the results of their experiment are in shown in the table.
| 0-20 | 21-30 | more than 30 | |
|---|---|---|---|
| 8th grade | 25 | 45 | 30 |
based on the results, what is the experimental probability that a student is in the 7th grade and completed more than 30 delta math lessons?
type a response.
Step1: Find total number of students
First, we calculate the total number of students by adding up all the values in the table.
For 7th grade: \(15 + 25 + 60 = 100\)
For 8th grade: \(25 + 45 + 30 = 100\)
Total students: \(100 + 100 = 200\)
Step2: Find number of 7th graders with >30 lessons
From the table, the number of 7th grade students who completed more than 30 Delta math lessons is 60.
Step3: Calculate experimental probability
Experimental probability is the number of favorable outcomes (7th grade, >30 lessons) divided by the total number of outcomes (total students).
So, probability \(= \frac{\text{Number of 7th graders with >30 lessons}}{\text{Total number of students}} = \frac{60}{200}\)
Simplify the fraction: \(\frac{60}{200} = \frac{3}{10} = 0.3\)

Snap & solve any problem in the app
Get step-by-step solutions on Sovi AI
Photo-based solutions with guided steps
Explore more problems and detailed explanations
\(0.3\) (or \(\frac{3}{10}\))