QUESTION IMAGE
Question
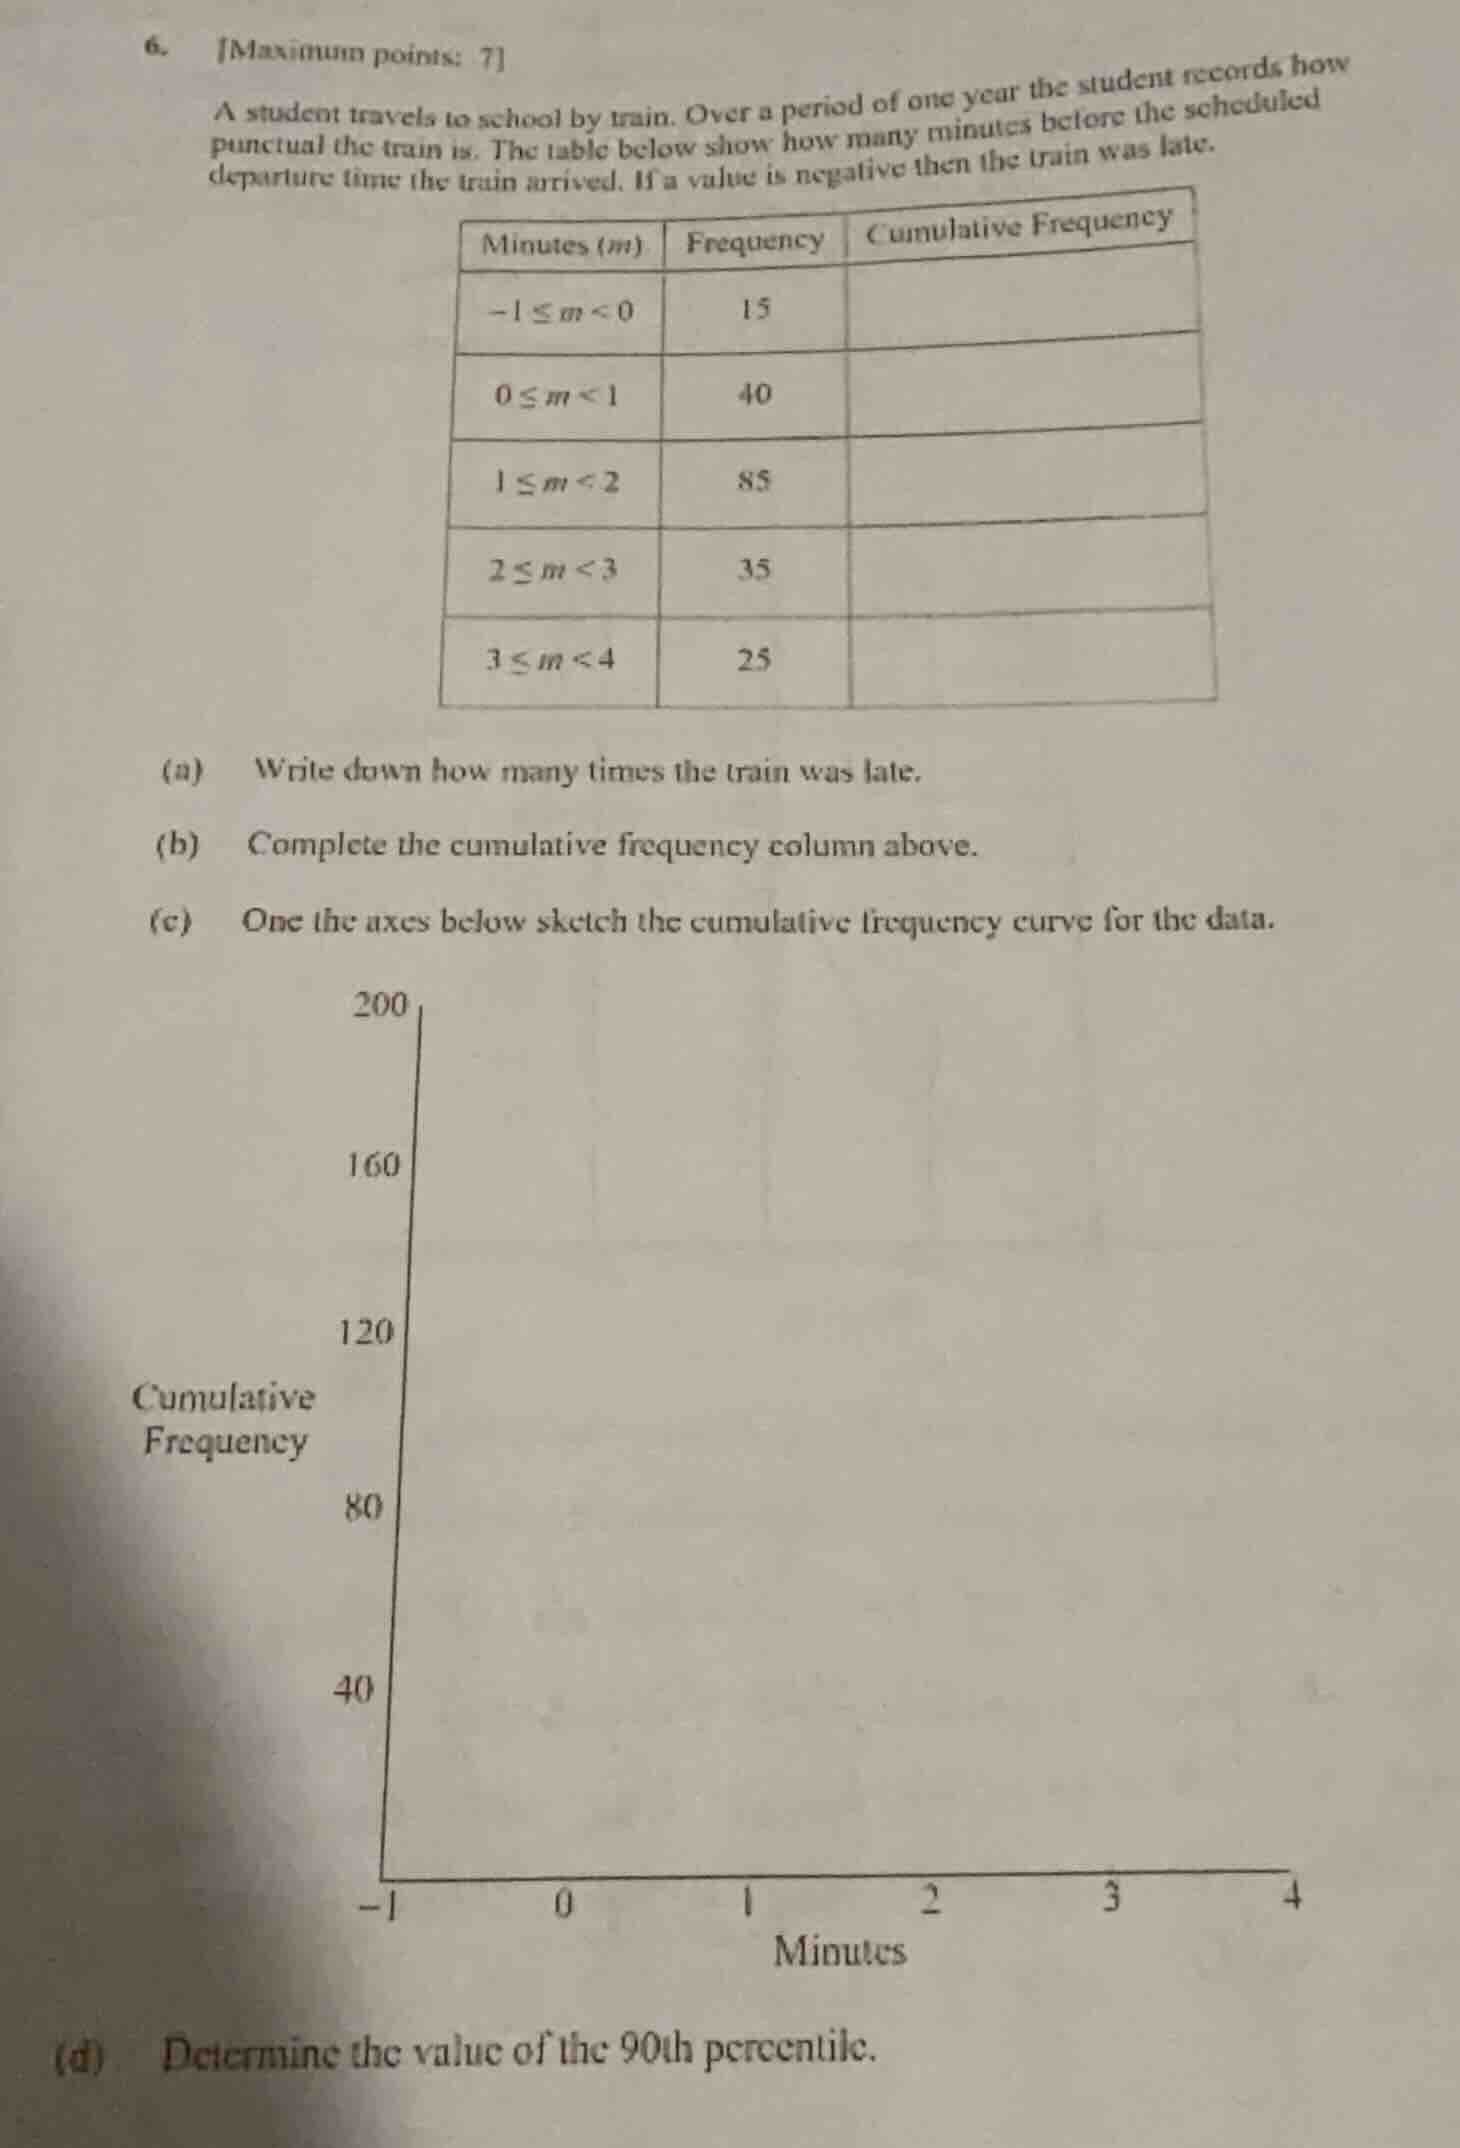
- maximum points: 7a student travels to school by train. over a period of one year the student records how punctual the train is. the table below show how many minutes before the scheduled departure time the train arrived. if a value is negative then the train was late.| minutes (m) | frequency | cumulative frequency || ---- | ---- | ---- || $-1 \leq m < 0$ | 15 | || $0 \leq m < 1$ | 40 | || $1 \leq m < 2$ | 85 | || $2 \leq m < 3$ | 35 | || $3 \leq m < 4$ | 25 | |(a) write down how many times the train was late.(b) complete the cumulative frequency column above.(c) on the axes below sketch the cumulative frequency curve for the data.(d) determine the value of the 90th percentile.
Step1: Identify late train frequency
The interval $-1 \leq m < 0$ represents late trains.
Frequency = $15$
Step2: Calculate cumulative frequencies
Add frequencies sequentially:
- First interval: $15$
- Second interval: $15 + 40 = 55$
- Third interval: $55 + 85 = 140$
- Fourth interval: $140 + 35 = 175$
- Fifth interval: $175 + 25 = 200$
Step3: Define 90th percentile position
Total data points $n=200$.
Position = $\frac{90}{100} \times 200 = 180$
Step4: Locate percentile interval
180 falls in $2 \leq m < 3$ (cumulative freq 175 to 200).
Use percentile formula:
$$P_{90} = L + \frac{\frac{90n}{100} - F}{f} \times w$$
Where $L=2$, $F=175$, $f=25$, $w=1$
$$P_{90} = 2 + \frac{180 - 175}{25} \times 1 = 2 + 0.2 = 2.2$$

Snap & solve any problem in the app
Get step-by-step solutions on Sovi AI
Photo-based solutions with guided steps
Explore more problems and detailed explanations
(a) 15
(b) Cumulative frequencies (top to bottom): 15, 55, 140, 175, 200
(c) (Sketch: Plot points (-1,0), (0,15), (1,55), (2,140), (3,175), (4,200) and draw a smooth curve connecting them)
(d) 2.2