QUESTION IMAGE
Question
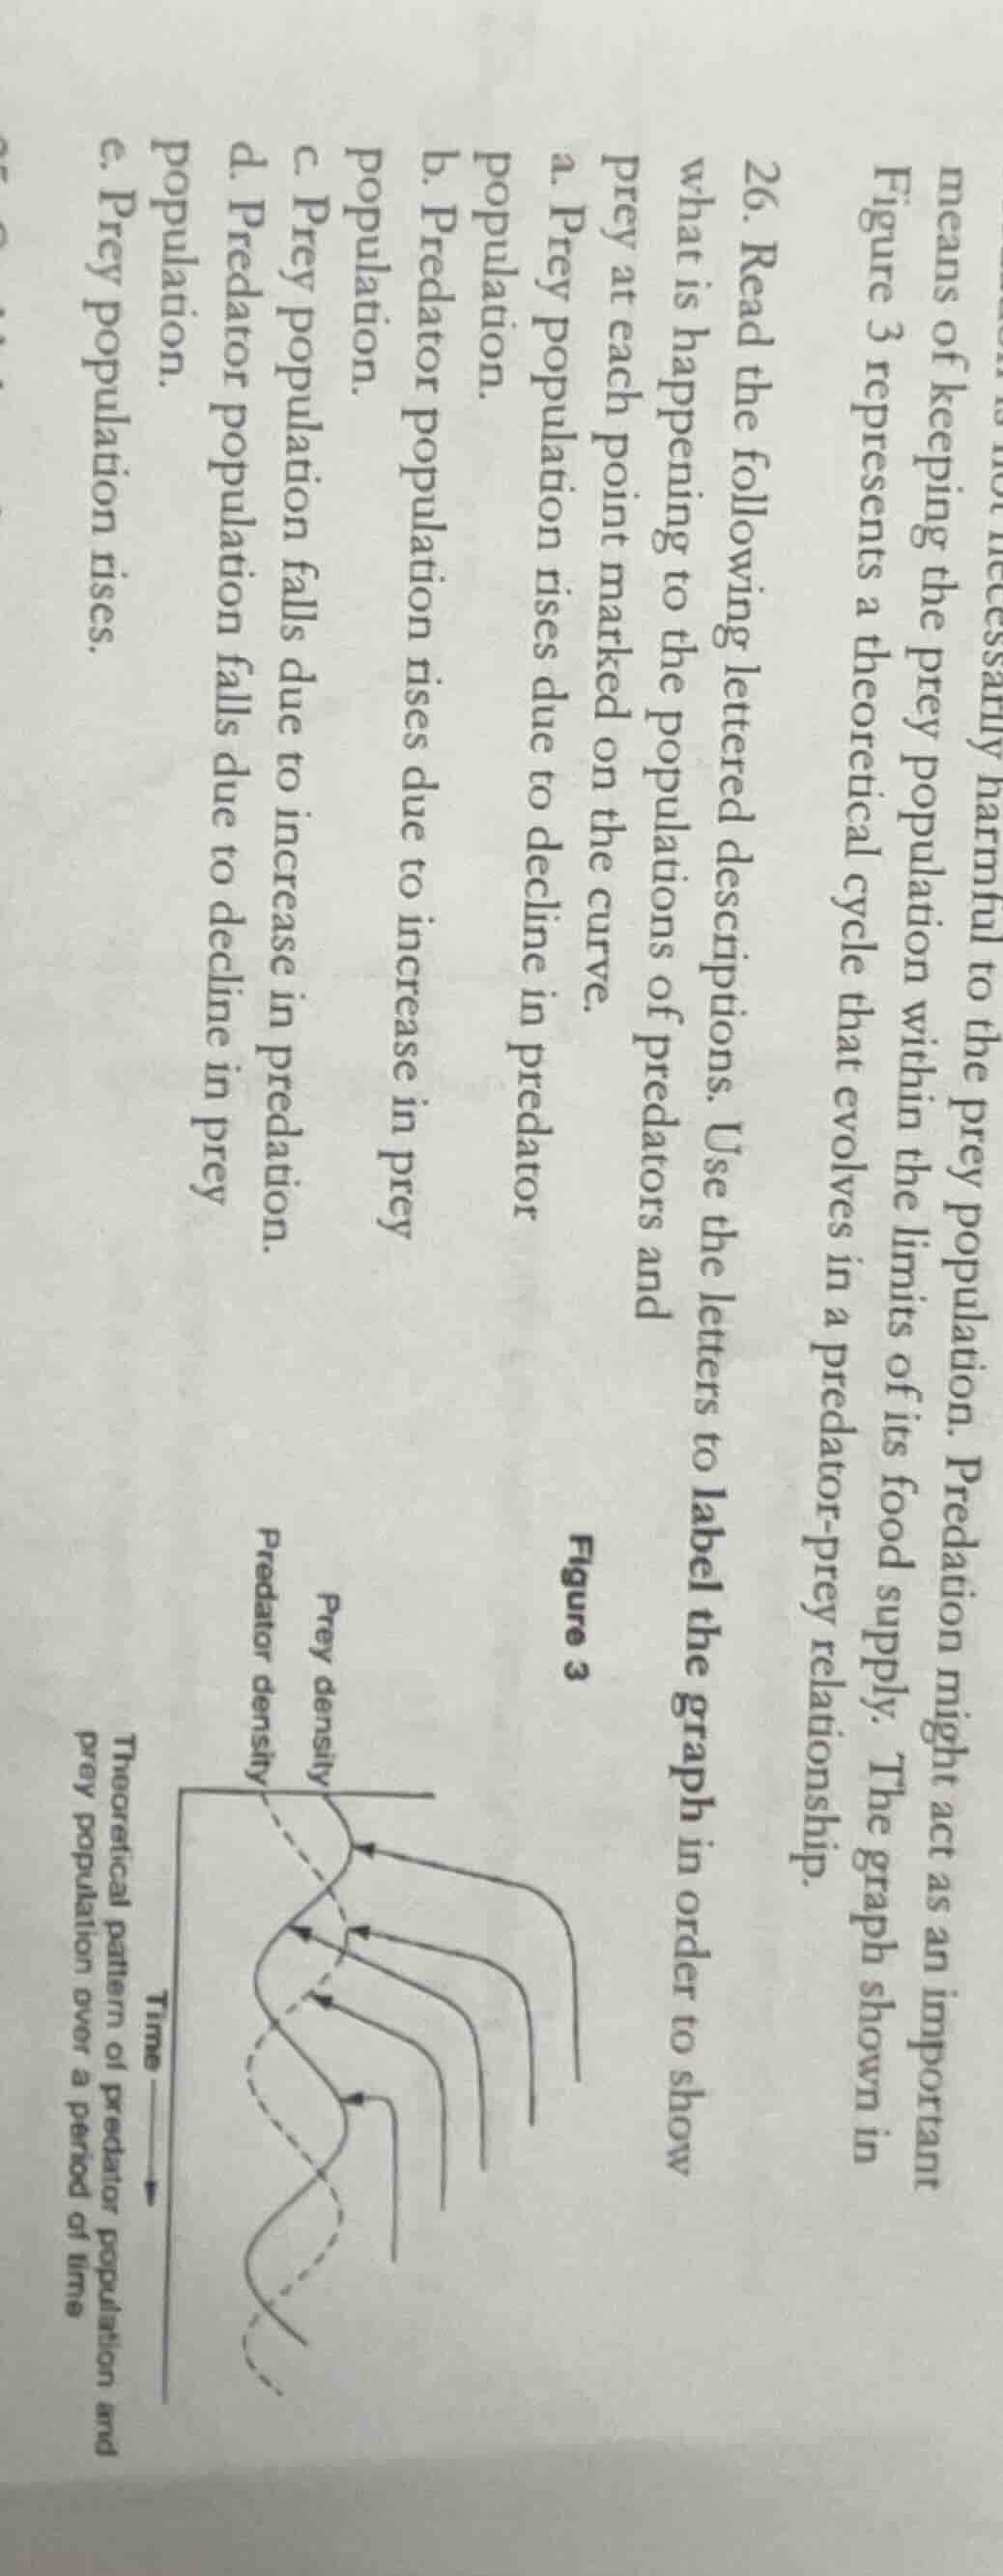
means of keeping the prey population within the limits of its food supply. the graph shown in figure 3 represents a theoretical cycle that evolves in a predator - prey relationship.
- read the following lettered descriptions. use the letters to label the graph in order to show what is happening to the populations of predators and prey at each point marked on the curve.
a. prey population rises due to decline in predator population.
b. predator population rises due to increase in prey population.
c. prey population falls due to increase in predation.
d. predator population falls due to decline in prey population.
e. prey population rises.
Brief Explanations
- Topmost arrow (Prey density peak): When prey population is high, there is more food for predators, so predator numbers rise. This matches description b. Predator population rises due to increase in prey population.
- Second arrow (Predator density peak after prey peak): High predator numbers lead to heavy predation, causing the prey population to drop. This matches description c. Prey population falls due to increase in predation.
- Third arrow (Prey density low point): When prey is scarce, predators lack food, so their population declines. This matches description d. Predator population falls due to decline in prey population.
- Fourth arrow (Predator density low point after prey low): With fewer predators, prey experience less predation, so their population increases. This matches description a. Prey population rises due to decline in predator population.
- Fifth arrow (Prey density rising from low): This is the start of the prey population recovery, matching description e. Prey population rises.

Snap & solve any problem in the app
Get step-by-step solutions on Sovi AI
Photo-based solutions with guided steps
Explore more problems and detailed explanations
- Top arrow: b. Predator population rises due to increase in prey population.
- Second arrow: c. Prey population falls due to increase in predation.
- Third arrow: d. Predator population falls due to decline in prey population.
- Fourth arrow: a. Prey population rises due to decline in predator population.
- Bottom arrow: e. Prey population rises.