QUESTION IMAGE
Question
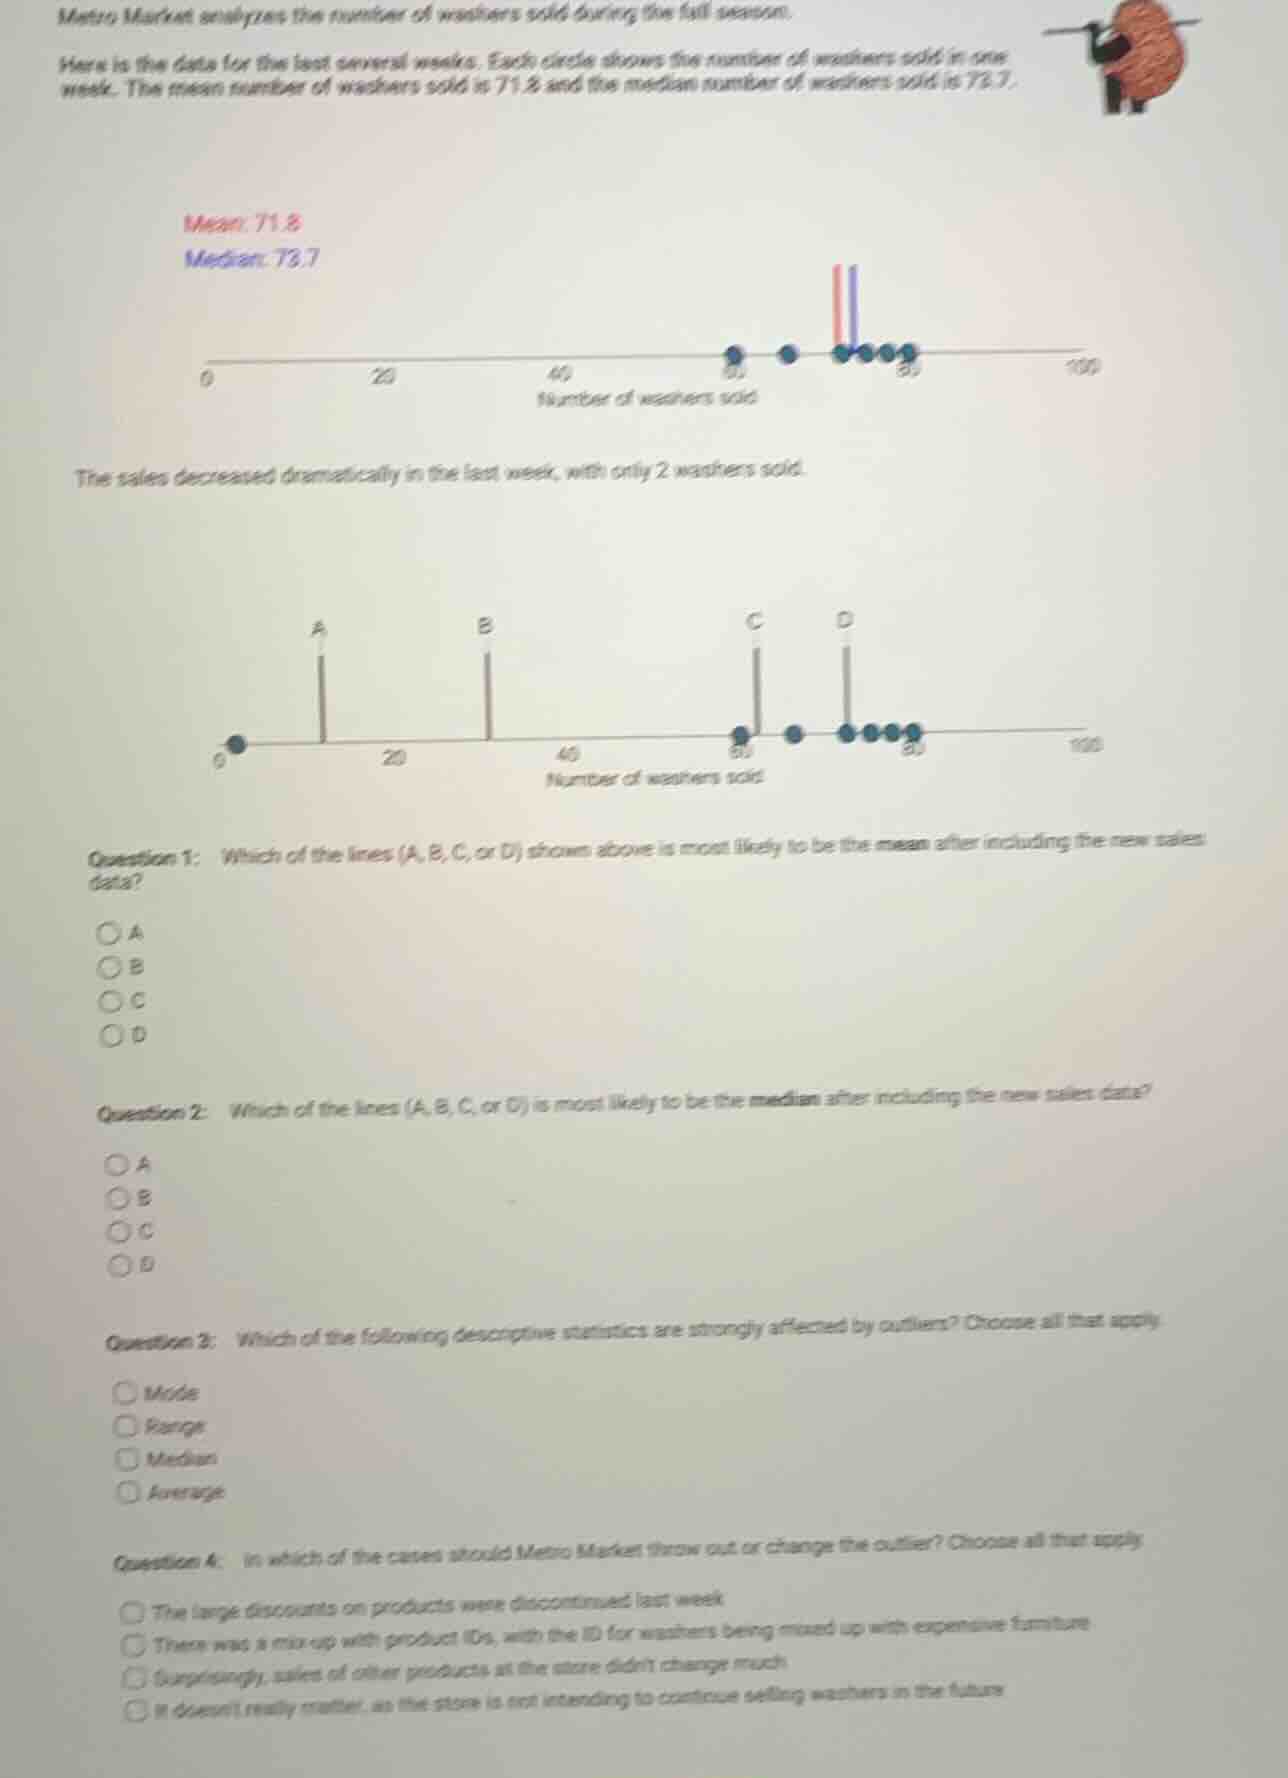
metro market analyzes the number of washers sold during the fall season.
here is the data for the last several weeks. each circle shows the number of washers sold in one week. the mean number of washers sold is 71.8 and the median number of washers sold is 73.7.
mean: 71.8
median: 73.7
the sales decreased dramatically in the last week, with only 2 washers sold.
question 1: which of the lines (a, b, c, or d) shown above is most likely to be the mean after including the new sales data?
a
b
c
d
question 2: which of the lines (a, b, c, or d) is most likely to be the median after including the new sales data?
a
b
c
d
question 3: which of the following descriptive statistics are strongly affected by outliers? choose all that apply.
mode
range
median
average
question 4: in which of the cases should metro market throw out or change the outlier? choose all that apply
the large discounts on products were discontinued last week
there was a mix - up with product ids, with the id for washers being mixed up with expensive furniture
surprisingly, sales of other products at the store didnt change much
it doesnt really matter, as the store is not intending to continue selling washers in the future
Step1: Analyze effect of outlier on mean
The original mean is 71.8. Adding a very low value (2, an outlier) will pull the mean downward significantly. Among lines A, B, C, D, line B is the only one far below the original mean's position (near 60-80), so it matches the shifted mean.
Step2: Analyze effect of outlier on median
The median is resistant to outliers. The original median is 73.7. Adding one low value will only shift the median slightly (or leave it close to the original cluster). Line D is near the original data cluster, so it matches the stable median.
Step3: Identify outlier-sensitive statistics
Mean (Average) is pulled by outliers; Range is calculated as max-min, so an outlier changes min/max drastically. Median and Mode are resistant to outliers.
Step4: Determine valid outlier removal cases
Outliers can be adjusted if the data is erroneous (product ID mix-up) or if the data is no longer relevant (store stops selling washers). A legitimate sales drop (discount end) or unrelated product sales are not valid reasons to remove the outlier.

Snap & solve any problem in the app
Get step-by-step solutions on Sovi AI
Photo-based solutions with guided steps
Explore more problems and detailed explanations
Question 1: B. Line B
Question 2: D. Line D
Question 3: Range, Average
Question 4: There was a mix-up with product IDs, with the ID for washers being mixed up with expensive furniture; It doesn't really matter, as the store is not intending to continue selling washers in the future