QUESTION IMAGE
Question
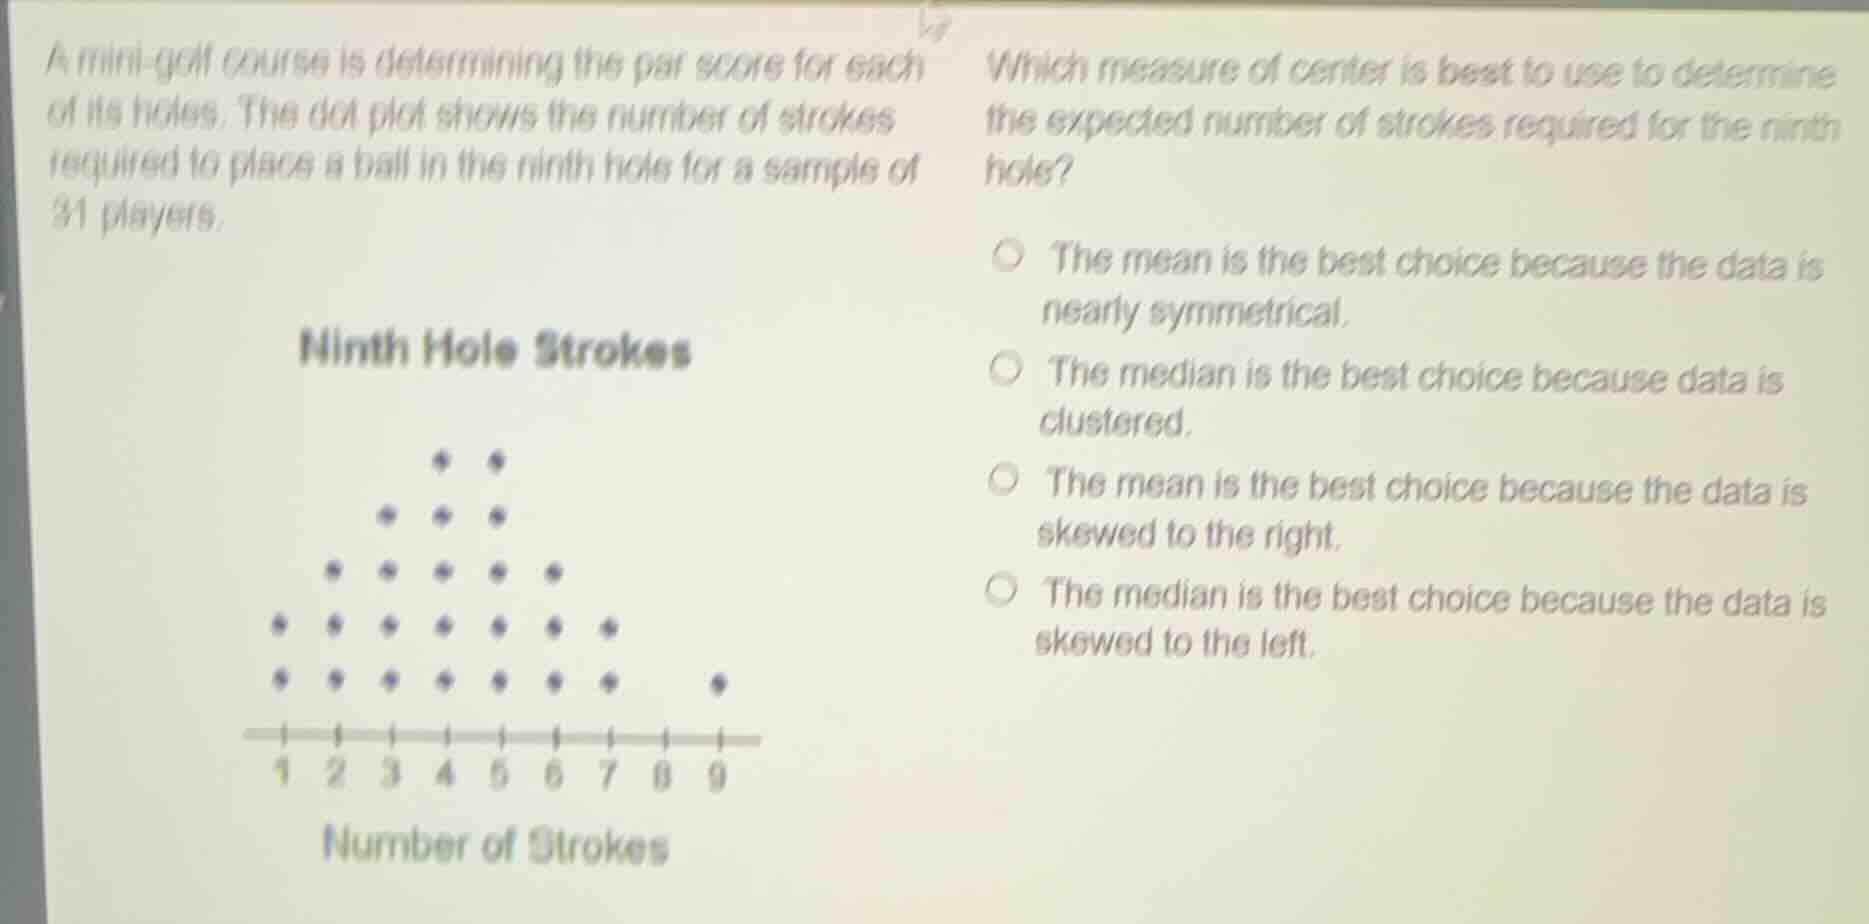
a mini - golf course is determining the par score for each of its holes. the dot plot shows the number of strokes required to place a ball in the ninth hole for a sample of 31 players.
ninth hole strokes
dot plot with number of strokes on the x - axis from 1 to 9 and corresponding dots
number of strokes
which measure of center is best to use to determine the expected number of strokes required for the ninth hole?
- the mean is the best choice because the data is nearly symmetrical.
- the median is the best choice because data is clustered.
- the mean is the best choice because the data is skewed to the right.
- the median is the best choice because the data is skewed to the left.
To determine the best measure of center, we analyze the dot - plot's symmetry. A nearly symmetrical data set is well - represented by the mean because the mean takes into account all data points and is not affected by the symmetry in a negative way (unlike in skewed data where the median is better). The dot - plot here appears nearly symmetrical. For skewed data, the median is a better measure as it is resistant to outliers, but when data is symmetrical, the mean is appropriate as it uses all the data values to give a central tendency measure. The first option states that the mean is the best choice because the data is nearly symmetrical, which matches our analysis. The other options have incorrect reasoning: a skewed data would be better served by the median, and the data here is not skewed in a way that would make the median the best choice as the other options suggest.

Snap & solve any problem in the app
Get step-by-step solutions on Sovi AI
Photo-based solutions with guided steps
Explore more problems and detailed explanations
A. The mean is the best choice because the data is nearly symmetrical.