QUESTION IMAGE
Question
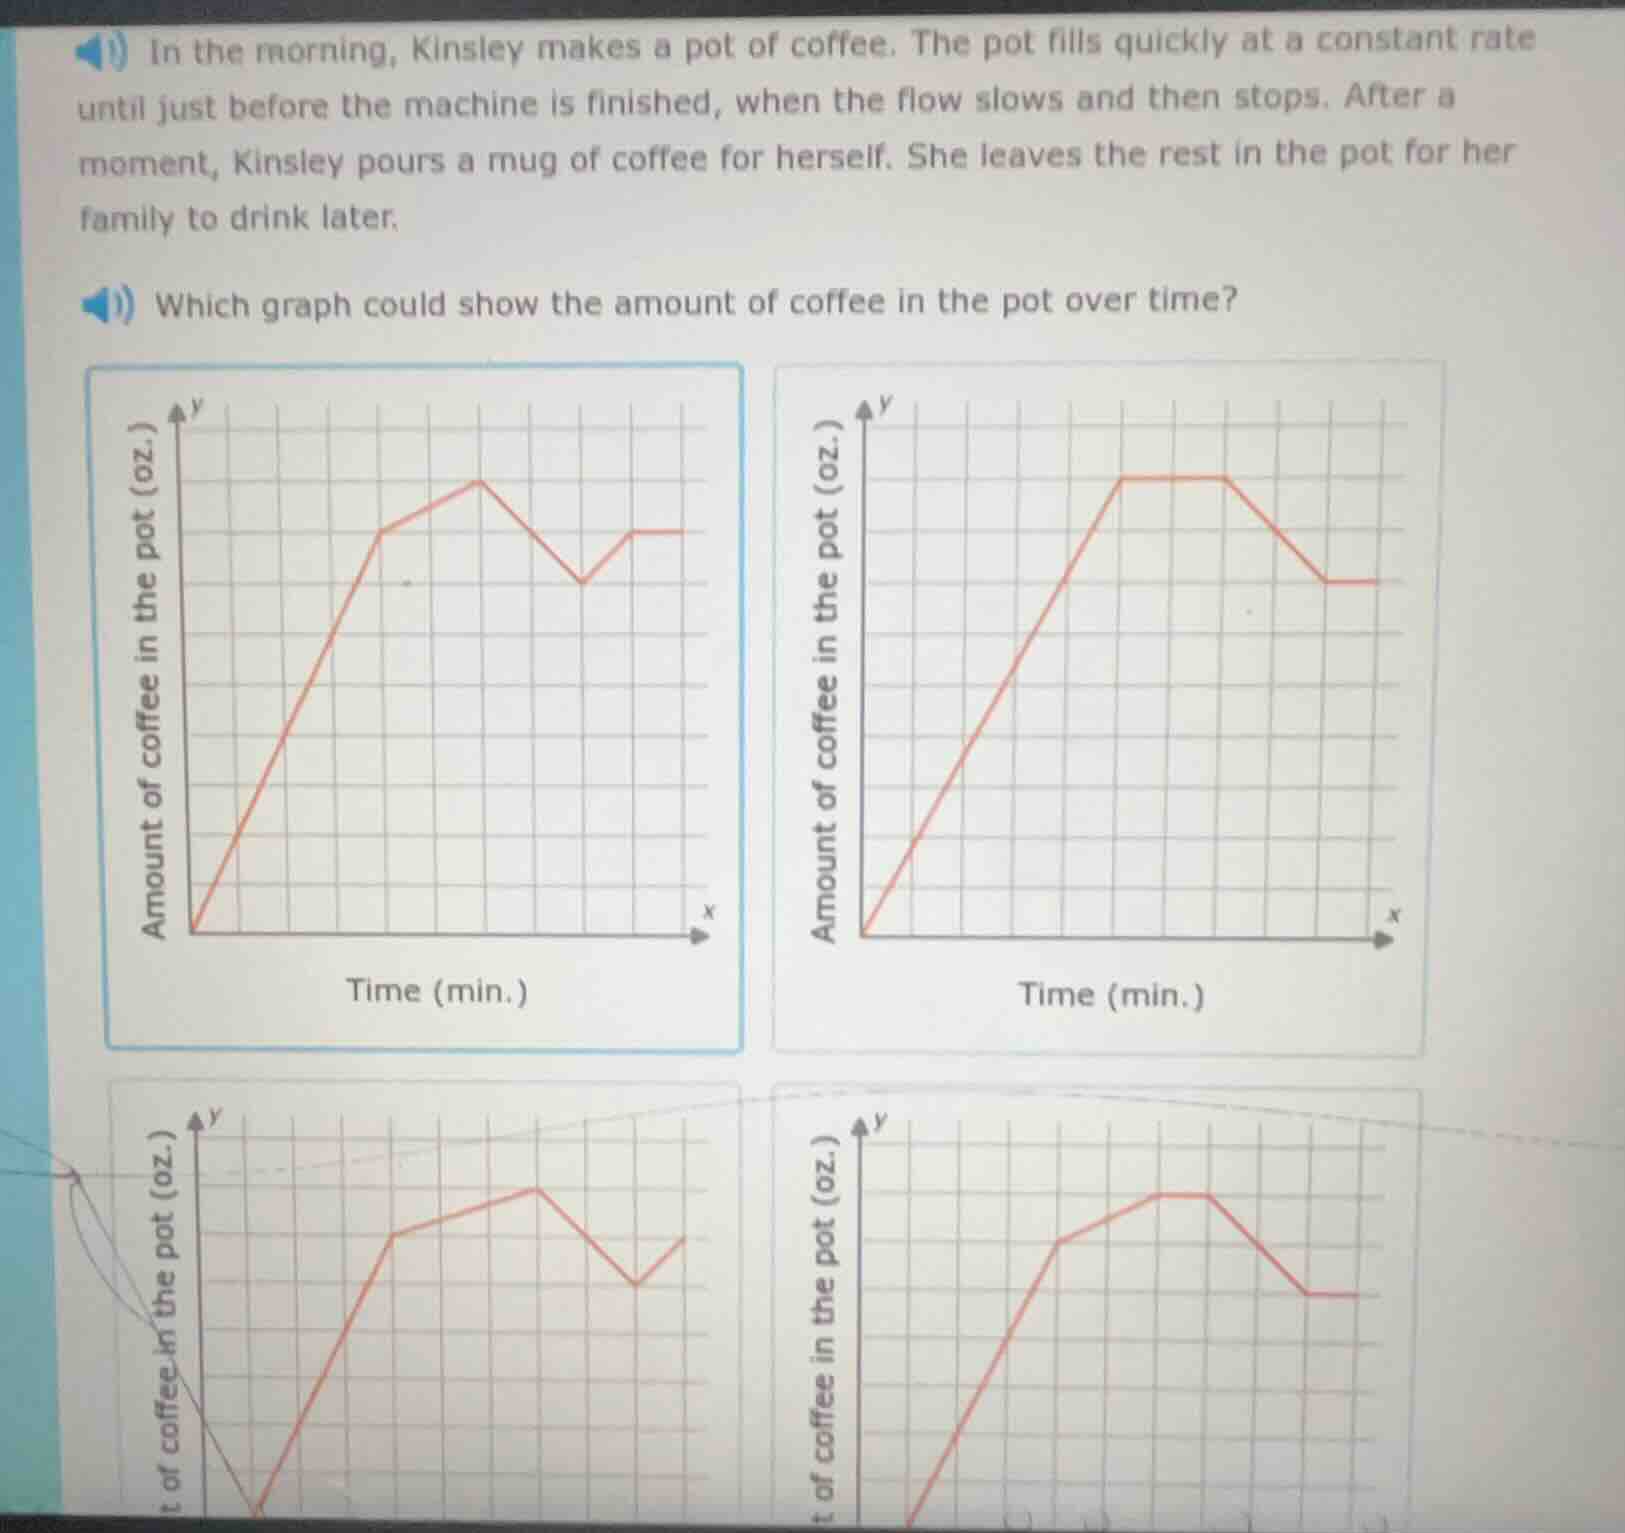
in the morning, kinsley makes a pot of coffee. the pot fills quickly at a constant rate until just before the machine is finished, when the flow slows and then stops. after a moment, kinsley pours a mug of coffee for herself. she leaves the rest in the pot for her family to drink later. which graph could show the amount of coffee in the pot over time?
Step1: Analyze filling phase
The pot fills quickly at a constant rate (steep positive slope), then slows (gentler positive slope) before stopping (flat line).
Step2: Analyze post-filling phase
After stopping, the amount stays constant (flat line) until Kinsley pours a mug (steep negative slope), then stays constant at the lower amount (flat line).
Step3: Match to graphs
Eliminate graphs with unexpected increases after pouring, or incorrect filling slopes. The bottom-right graph matches all phases: steep rise, gentle rise, flat, steep drop, flat.

Snap & solve any problem in the app
Get step-by-step solutions on Sovi AI
Photo-based solutions with guided steps
Explore more problems and detailed explanations
The bottom-right graph (with steep initial rise, gentle final rise, flat plateau, steep drop, and final flat line)