QUESTION IMAGE
Question
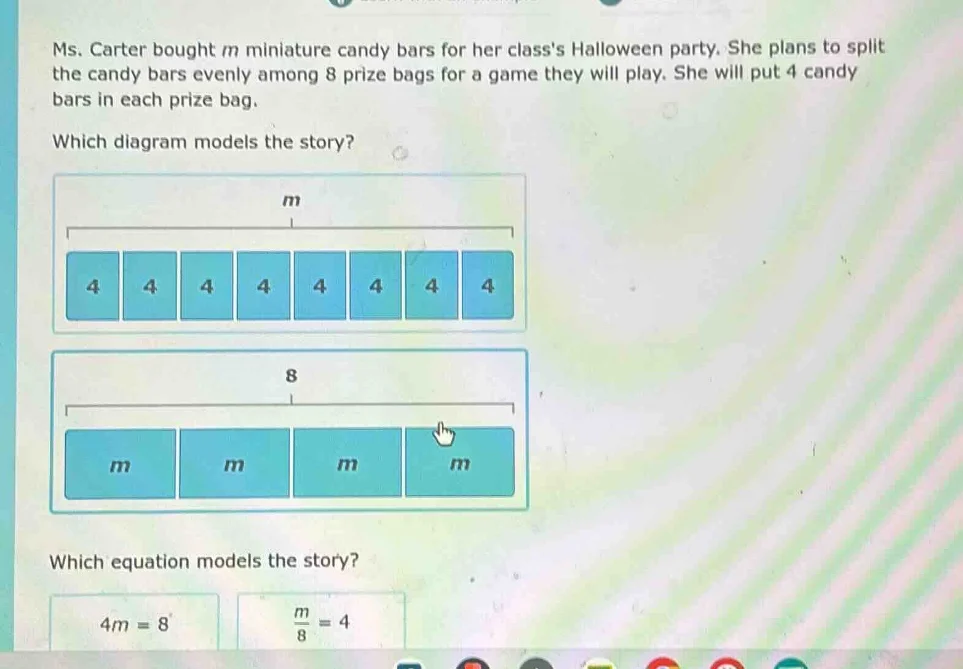
ms. carter bought m miniature candy bars for her classs halloween party. she plans to split the candy bars evenly among 8 prize bags for a game they will play. she will put 4 candy bars in each prize bag.
which diagram models the story?
diagram 1: a bar labeled m with 8 sections each labeled 4
diagram 2: a bar labeled 8 with 4 sections each labeled m
which equation models the story?
$4m = 8$ $\frac{m}{8} = 4$
Diagram Modeling the Story:
The total number of candy bars is \( m \), which is split into 8 prize bags, each with 4 candy bars. The first diagram has a total labeled \( m \) and 8 sections each with 4, matching the story (8 bags, 4 per bag, total \( m \)). The second diagram labels total as 8 with 4 sections of \( m \), which doesn't match. So the first diagram (with \( m \) at the top and 8 boxes of 4) models the story.
Equation Modeling the Story:
Step1: Analyze the relationship
Total candy bars \( m \) divided by number of bags (8) equals candy per bag (4).
Step2: Form the equation
Mathematically, this is \( \frac{m}{8} = 4 \). The other equation \( 4m = 8 \) would imply \( m = 2 \), which doesn't fit (since 8 bags with 4 each need \( m = 32 \)).

Snap & solve any problem in the app
Get step-by-step solutions on Sovi AI
Photo-based solutions with guided steps
Explore more problems and detailed explanations
(Diagram): The first diagram (with \( m \) as the total and 8 boxes each containing 4).