QUESTION IMAGE
Question
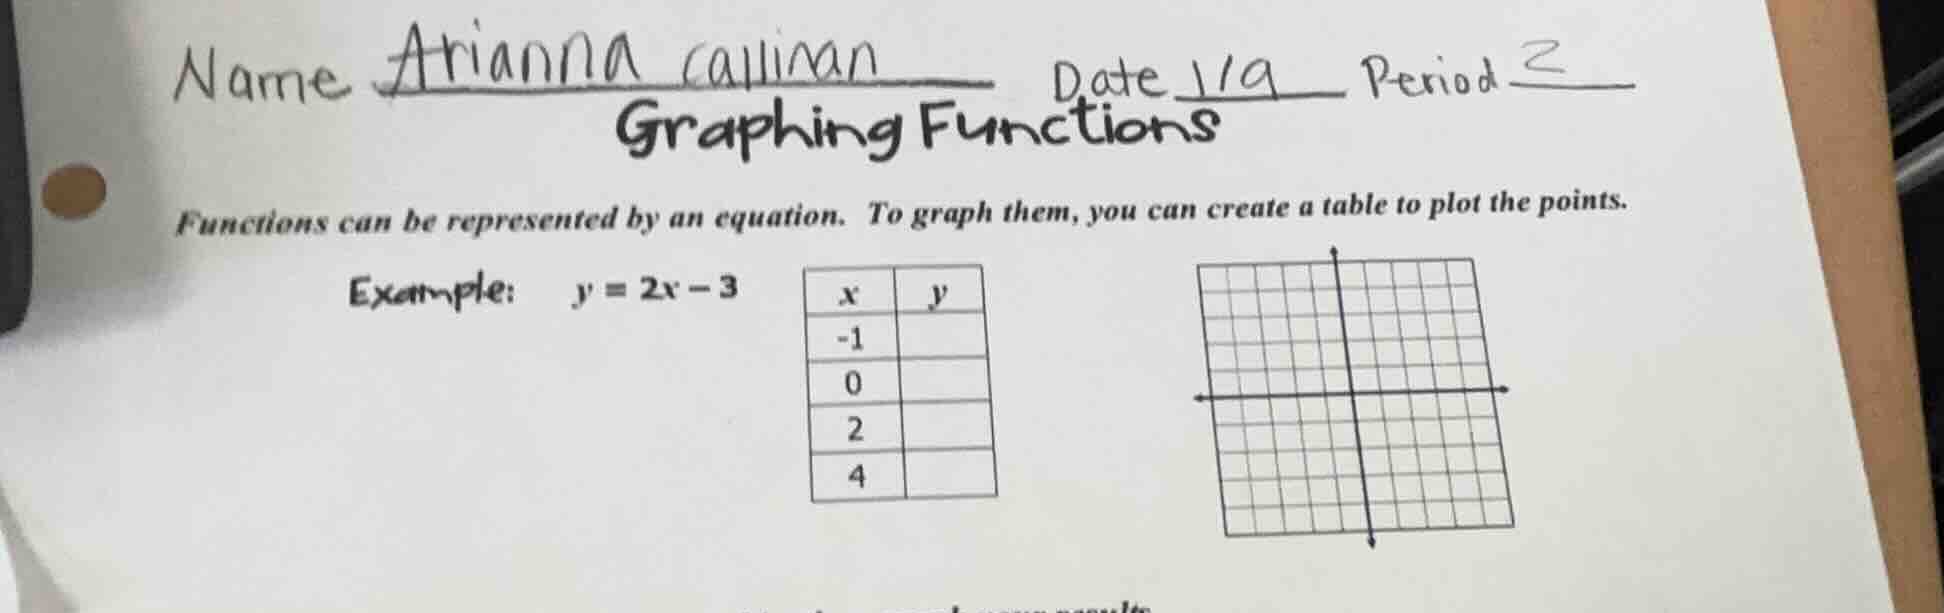
name arianna callinan date 1/9 period 2 graphing functions functions can be represented by an equation. to graph them, you can create a table to plot the points. example: $y = 2x - 3$ | x | y | | -1 | | | 0 | | | 2 | | | 4 | |
Step1: Substitute x=-1 into y=2x-3
$y = 2(-1) - 3 = -2 - 3 = -5$
Step2: Substitute x=0 into y=2x-3
$y = 2(0) - 3 = 0 - 3 = -3$
Step3: Substitute x=2 into y=2x-3
$y = 2(2) - 3 = 4 - 3 = 1$
Step4: Substitute x=4 into y=2x-3
$y = 2(4) - 3 = 8 - 3 = 5$

Snap & solve any problem in the app
Get step-by-step solutions on Sovi AI
Photo-based solutions with guided steps
Explore more problems and detailed explanations
Completed table:
| x | y |
|---|---|
| 0 | -3 |
| 2 | 1 |
| 4 | 5 |
The points to plot on the graph are $(-1, -5)$, $(0, -3)$, $(2, 1)$, and $(4, 5)$; connecting these points gives the line for $y=2x-3$.