QUESTION IMAGE
Question
name
date
homeroom
ms.clarke-davis/ms.jacobs/ms.castro
lesson 4.15-homework
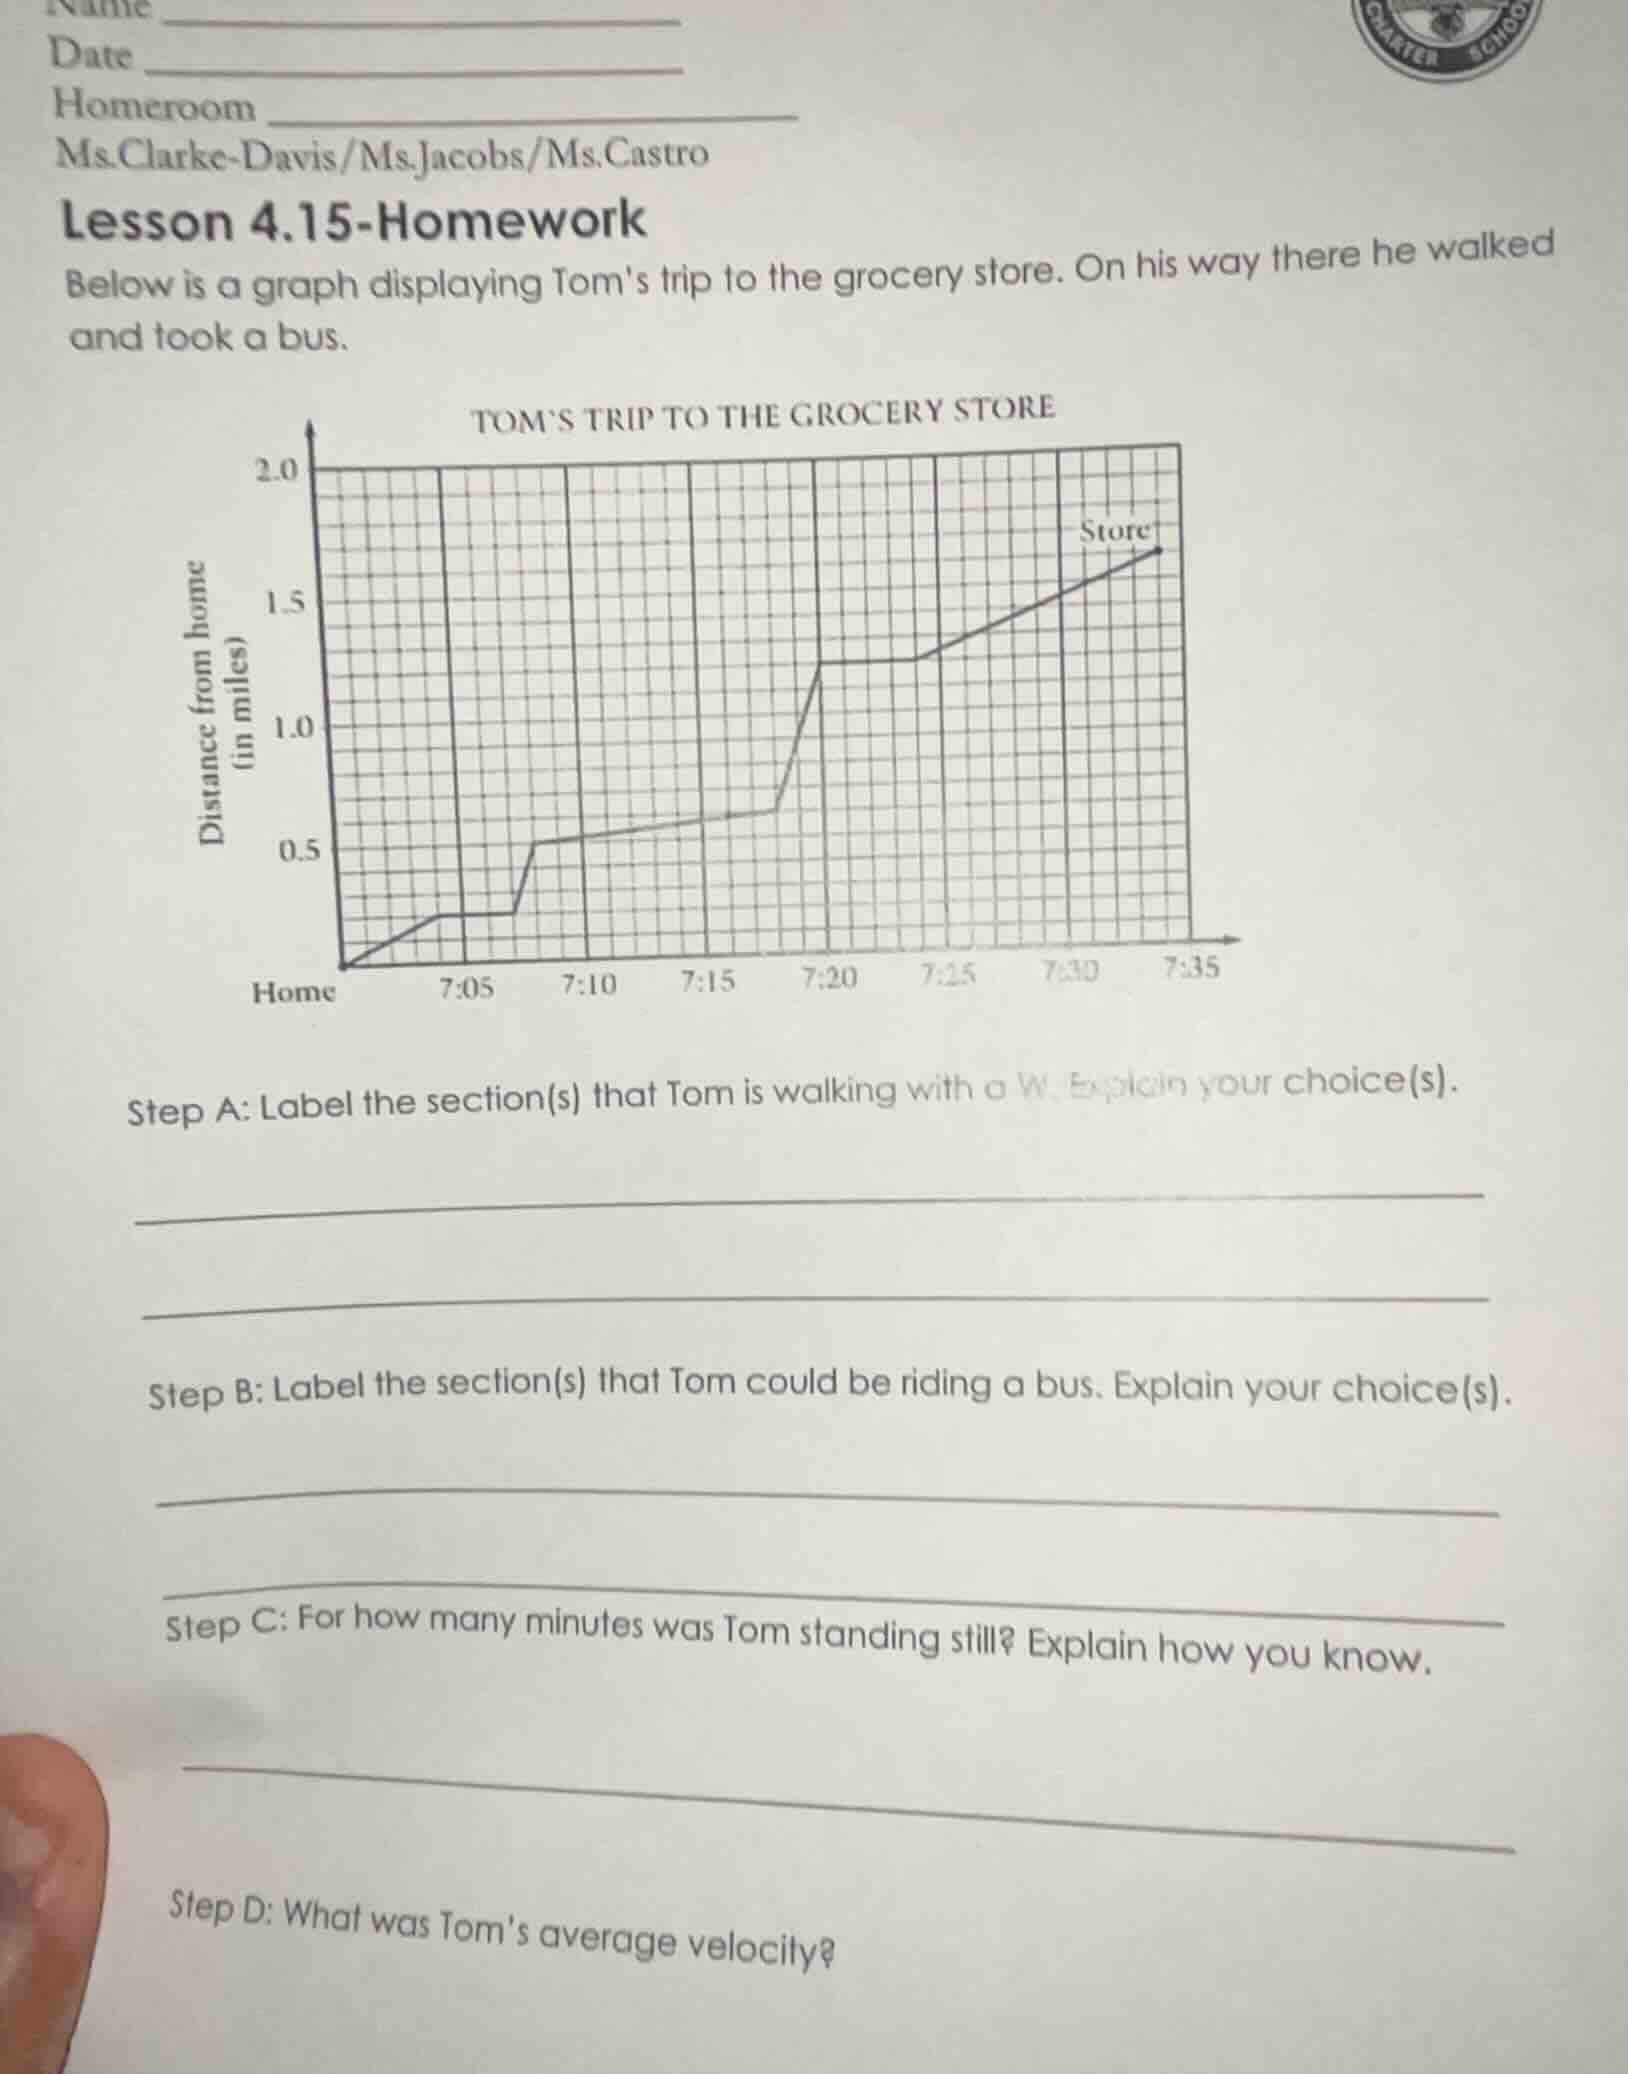
below is a graph displaying toms trip to the grocery store. on his way there he walked and took a bus.
toms trip to the grocery store
(graph: distance from home (in miles) on y-axis, time from 7:00 - 7:35 on x-axis, showing toms trip with segments of different slopes)
step a: label the section(s) that tom is walking with a w. explain your choice(s).
step b: label the section(s) that tom could be riding a bus. explain your choice(s).
step c: for how many minutes was tom standing still? explain how you know.
step d: what was toms average velocity?
Step A
Step1: Identify walking sections
Walking is slower, so sections with smaller slope (less steep) are walking. From Home to ~7:03, 7:07 - 7:19, 7:25 - 7:35 (estimate grid). Label these "W".
Step2: Explain
Walking speed is lower, so distance vs time has smaller slope (less distance per time) than bus (steeper). These sections have gentle slopes, so Tom walks here.
Step1: Identify bus sections
Bus is faster, so steeper slope sections. From ~7:03 - 7:07, 7:19 - 7:25 (steeper slopes). Label these as bus - riding.
Step2: Explain
Bus speed is higher, so distance increases faster (steeper slope) than walking. These sections have steep slopes, so Tom rides bus here.
Step1: Identify still sections
Still means distance doesn't change (horizontal line). From ~7:03 - 7:07? Wait, no: horizontal parts. Let's check time: 7:05 - 7:07? Wait, graph: horizontal from ~7:03 - 7:05 (2 minutes), and 7:20 - 7:25 (5 minutes)? Wait, grid: each vertical line is 5 minutes? Wait, x - axis: 7:05, 7:10, 7:15, 7:20, 7:25, 7:30, 7:35. Horizontal sections: between 7:03 - 7:05 (2 minutes) and 7:20 - 7:25 (5 minutes)? Wait, no, let's count. First horizontal: from ~7:03 to 7:05 (2 minutes), then 7:20 - 7:25 (5 minutes). Wait, total still time: 2 + 5 = 7? Wait, no, maybe I misread. Wait, the graph: first horizontal after home: from ~7:03 to 7:05 (2 minutes), then another horizontal from 7:20 to 7:25 (5 minutes). Wait, let's check the x - axis grid. Each small square: 1 minute? So from 7:05 to 7:07? Wait, the first horizontal: after the first slope, it's horizontal until 7:05? Wait, the problem says "standing still" is when distance doesn't change (horizontal line). So find all horizontal segments. Let's see:
- First horizontal: from ~7:03 to 7:05 (2 minutes)
- Second horizontal: from 7:20 to 7:25 (5 minutes)
Wait, no, maybe the first horizontal is from 7:03 to 7:05 (2 min), and the second from 7:20 to 7:25 (5 min). Wait, total still time: 2 + 5 = 7? Wait, no, maybe I made a mistake. Wait, the x - axis: 7:05, 7:10, etc. Let's count the minutes between horizontal lines. First horizontal: between ~7:03 and 7:05 (2 minutes). Second horizontal: between 7:20 and 7:25 (5 minutes). Wait, but maybe the first horizontal is from 7:05 to 7:07? No, the graph: Home, then slope, then horizontal (7:05 - 7:07? Wait, the label is 7:05, 7:10. So each vertical line is 5 minutes? No, the grid has small squares. Let's assume each small square is 1 minute. So from 7:05 to 7:07 (2 minutes) is horizontal, and 7:20 to 7:25 (5 minutes) is horizontal. Wait, but the answer is likely 2 + 5 = 7? Wait, no, maybe the first horizontal is 2 minutes (7:03 - 7:05) and the second is 5 minutes (7:20 - 7:25), total 7 minutes. Wait, but let's check again. The graph:
- From Home to ~7:03: slope (walking)
- ~7:03 - 7:05: horizontal (still, 2 minutes)
- 7:05 - 7:07: slope (bus, 2 minutes)
- 7:07 - 7:19: slope (walking, 12 minutes)
- 7:19 - 7:20: slope (bus, 1 minute)
- 7:20 - 7:25: horizontal (still, 5 minutes)
- 7:25 - 7:35: slope (walking, 10 minutes)
Wait, no, the time between 7:20 and 7:25 is 5 minutes (horizontal), and between ~7:03 and 7:05 is 2 minutes (horizontal). So total still time: 2 + 5 = 7 minutes.
Step2: Explain
Still time is when distance doesn't change (horizontal line on distance - time graph). We find horizontal segments, calculate their time length (end time - start time) and sum. First horizontal: 7:05 - 7:07? Wait, no, maybe the first horizontal is from 7:03 to 7:05 (2 minutes) and the second from 7:20 to 7:25 (5 minutes). So 2 + 5 = 7 minutes.

Snap & solve any problem in the app
Get step-by-step solutions on Sovi AI
Photo-based solutions with guided steps
Explore more problems and detailed explanations
Sections with gentle (small slope) distance - time graph (e.g., Home to ~7:03, 7:07 - 7:19, 7:25 - 7:35) are labeled "W" because walking is slower (smaller slope) than bus - riding.