QUESTION IMAGE
Question
name
disease transmission investigation p2
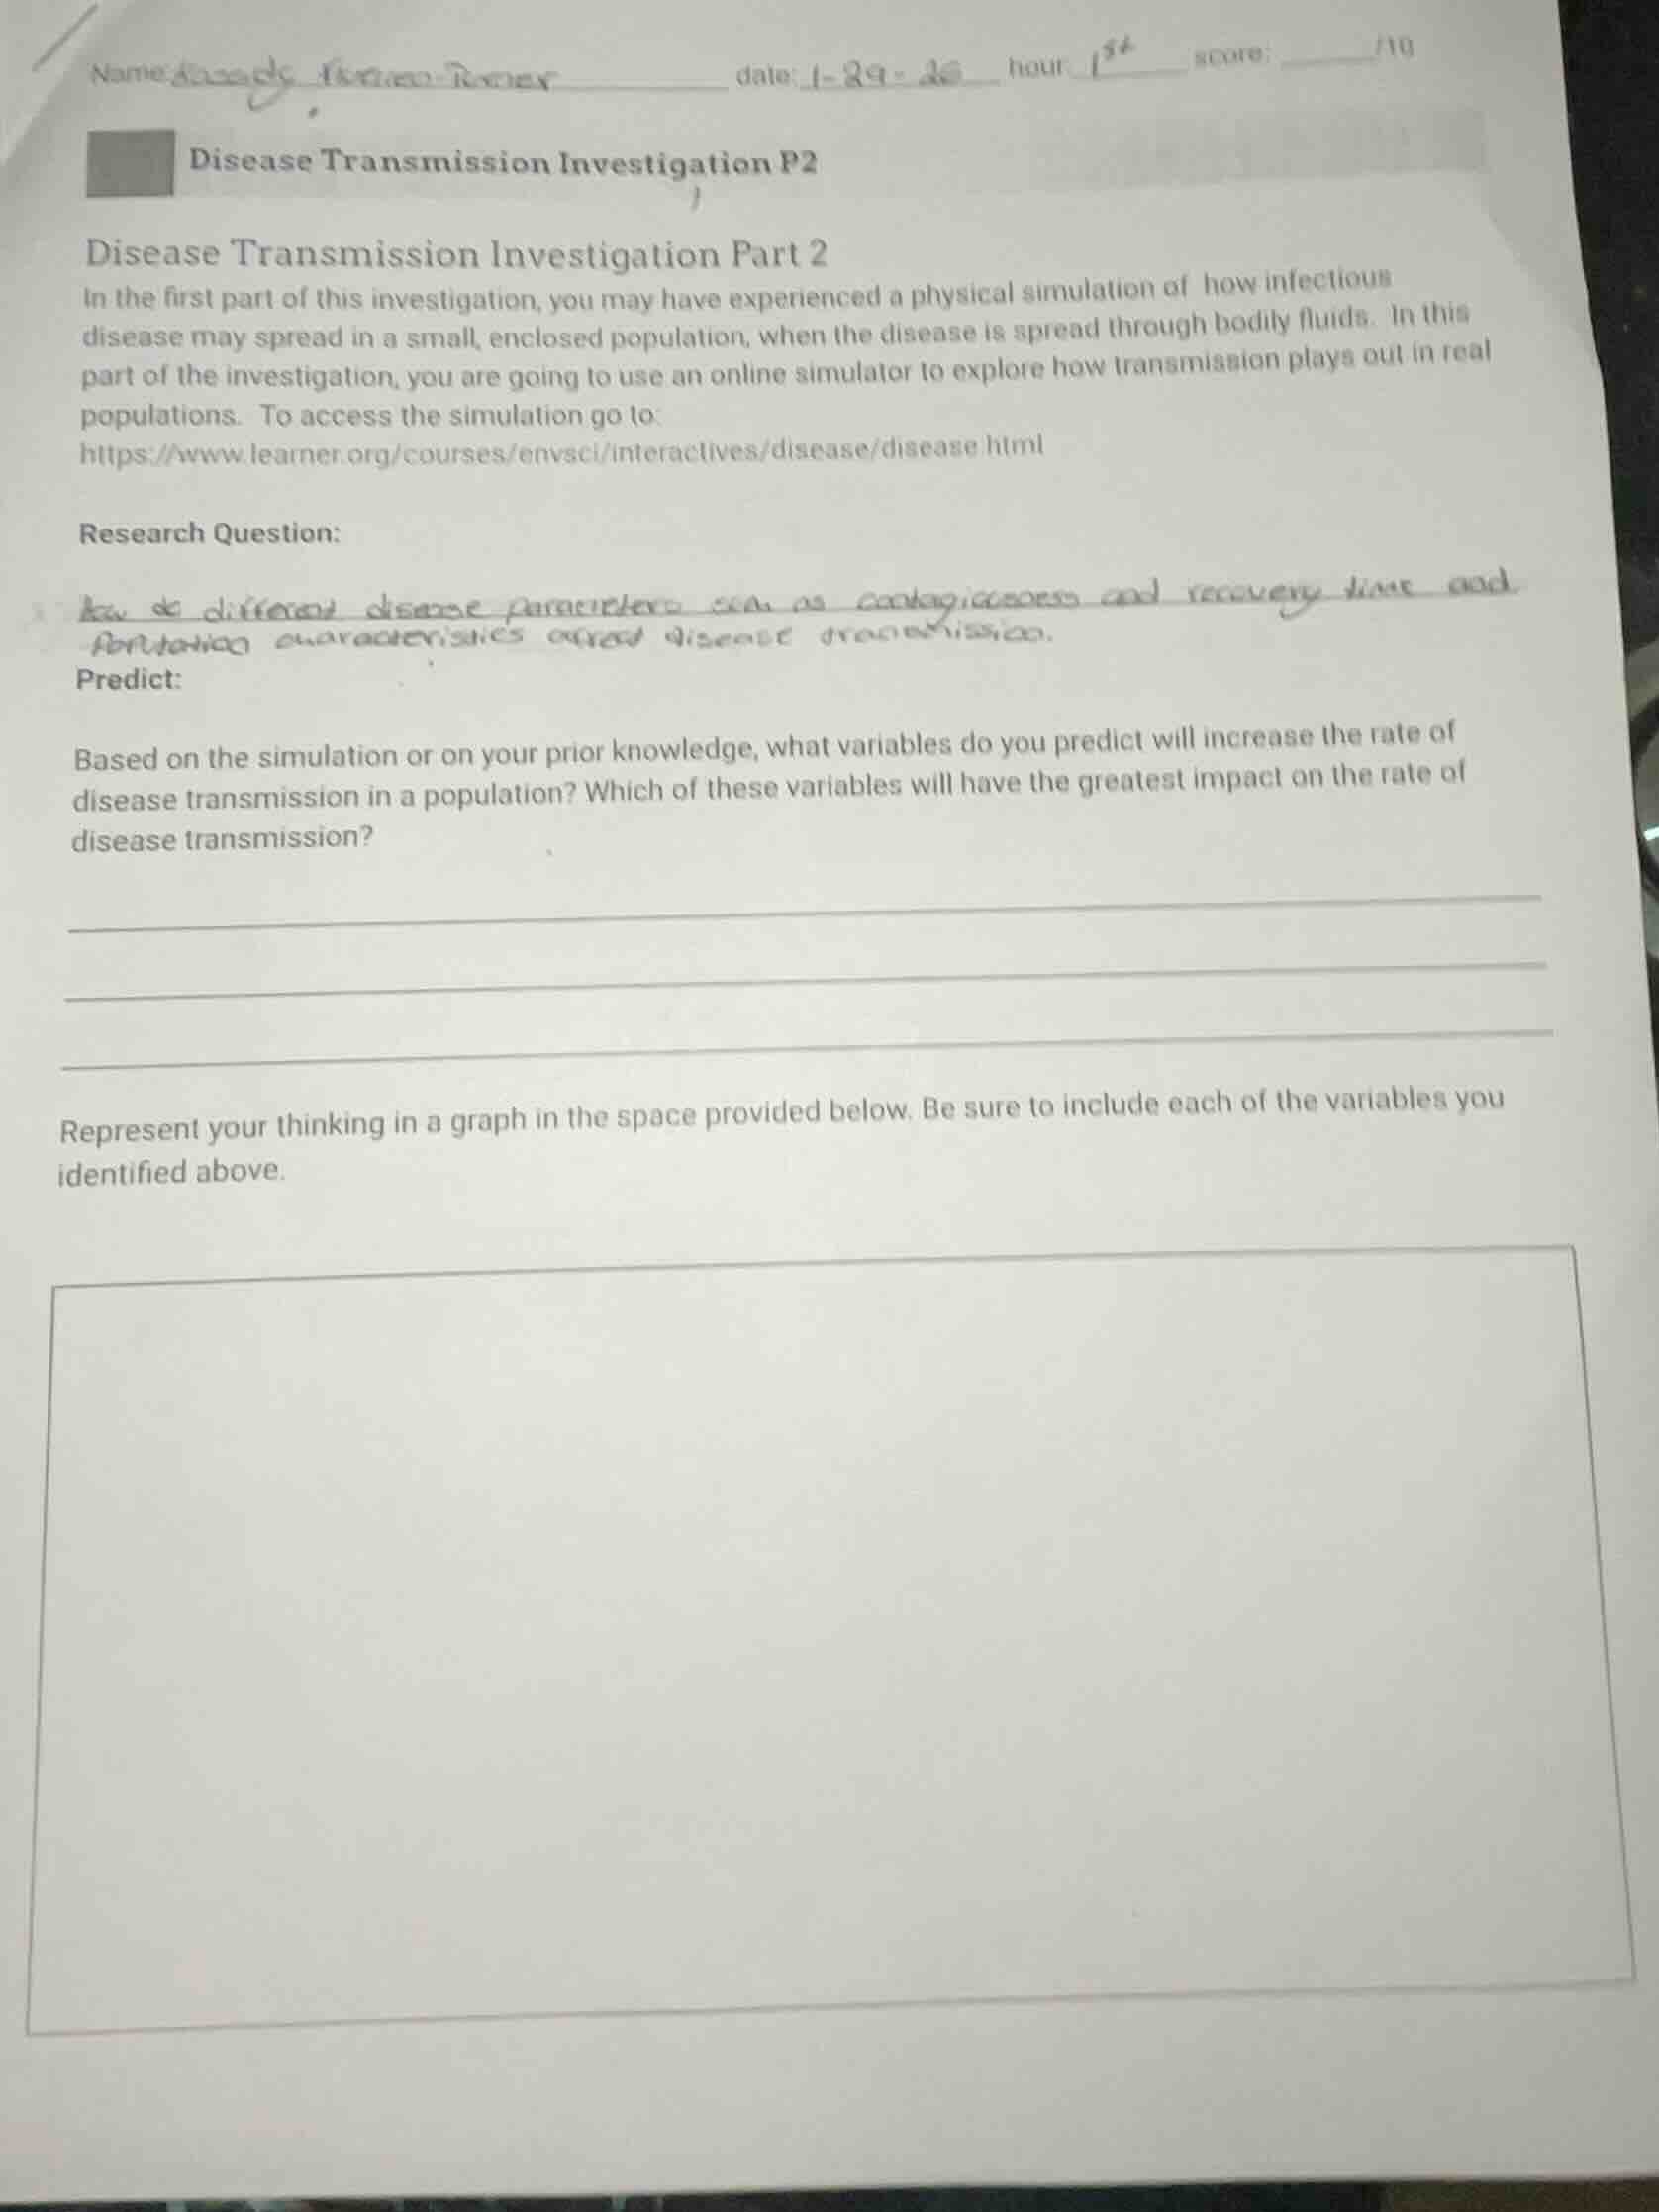
disease transmission investigation part 2
in the first part of this investigation, you may have experienced a physical simulation of how infectious
disease may spread in a small, enclosed population, when the disease is spread through bodily fluids. in this
part of the investigation, you are going to use an online simulator to explore how transmission plays out in real
populations. to access the simulation go to:
https://www.learner.org/courses/envsci/interactives/disease/disease.html
research question:
predict:
based on the simulation or on your prior knowledge, what variables do you predict will increase the rate of
disease transmission in a population? which of these variables will have the greatest impact on the rate of
disease transmission?
represent your thinking in a graph in the space provided below. be sure to include each of the variables you
identified above.
Variables that increase disease transmission rate include high contagiousness (easy spread between people), long infectious/recovery time (infected people spread disease longer), high population density (more frequent close contact), and lack of immunity in the population. High contagiousness has the greatest impact because it directly determines how easily the disease passes from one person to another, even with low contact frequency.
For the graph: Use a bar graph with the y-axis as "Relative Impact on Transmission Rate" and x-axis as the identified variables. The bar for "High Contagiousness" will be the tallest, followed by long recovery time, high population density, and low population immunity.

Snap & solve any problem in the app
Get step-by-step solutions on Sovi AI
Photo-based solutions with guided steps
Explore more problems and detailed explanations
- Variables predicted to increase disease transmission rate:
- High disease contagiousness
- Long infectious/recovery time
- High population density
- Low population immunity
- Variable with the greatest impact: High disease contagiousness
- Graph description: A bar graph where:
- X-axis: List of the four variables above
- Y-axis: Labeled "Relative Impact on Transmission Rate" (scale from 0 to 10)
- Bar heights (example values): High contagiousness = 9, Long recovery time = 7, High population density = 6, Low immunity = 5