QUESTION IMAGE
Question
name____ hour__ date____ environmental science
climograph analysis activity
worksheet 3
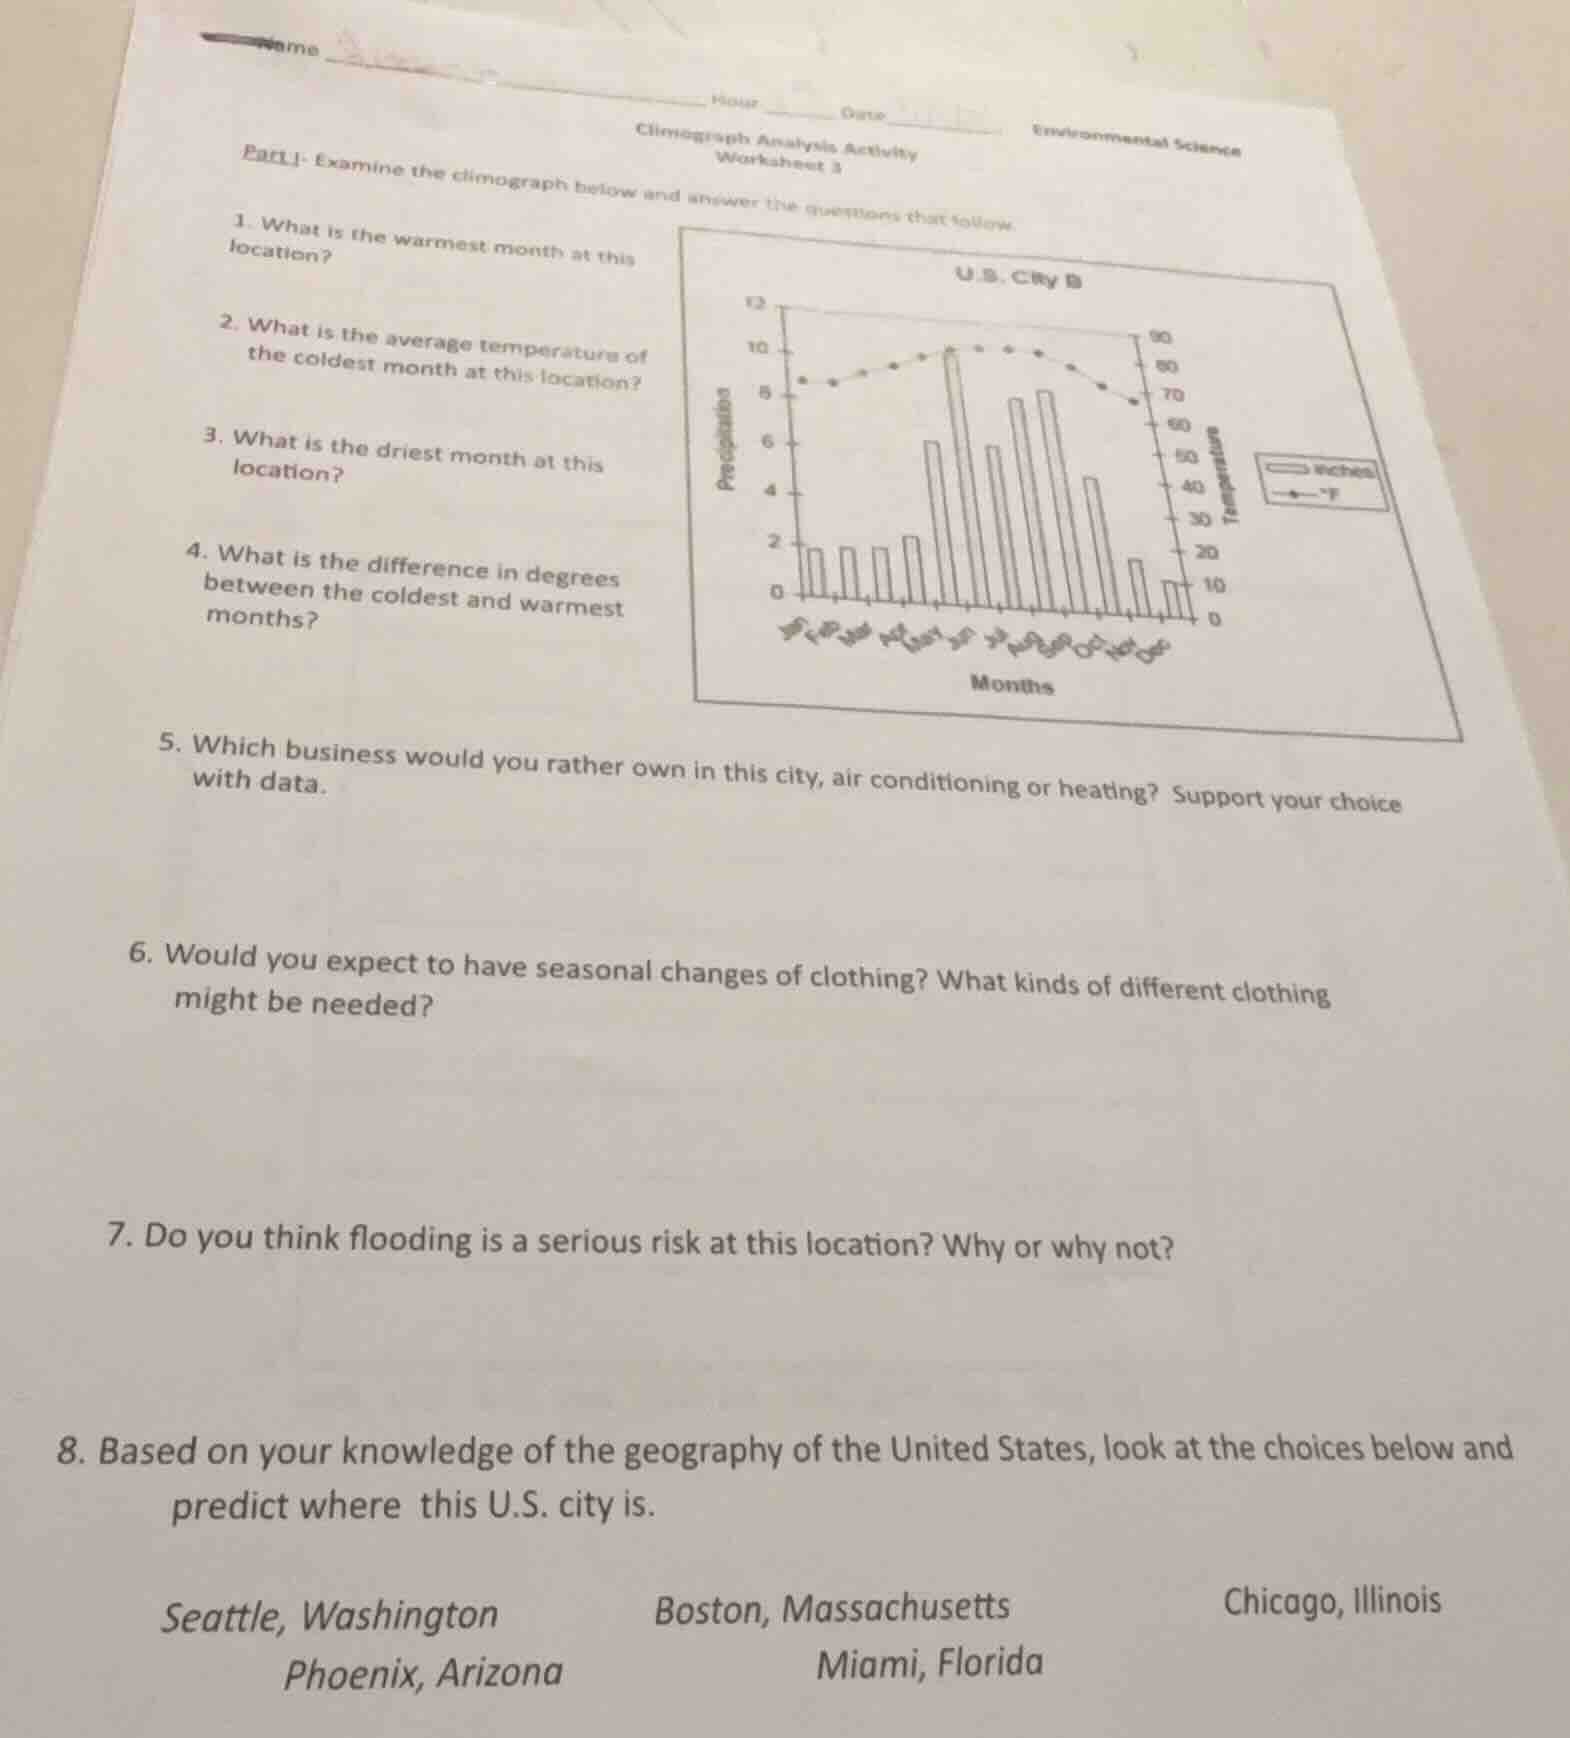
part i- examine the climograph below and answer the questions that follow.
- what is the warmest month at this location?
- what is the average temperature of the coldest month at this location?
- what is the driest month at this location?
- what is the difference in degrees between the coldest and warmest months?
- which business would you rather own in this city, air conditioning or heating? support your choice with data.
- would you expect to have seasonal changes of clothing? what kinds of different clothing might be needed?
- do you think flooding is a serious risk at this location? why or why not?
- based on your knowledge of the geography of the united states, look at the choices below and predict where this u.s. city is.
seattle, washington
boston, massachusetts
chicago, illinois
phoenix, arizona
miami, florida
Brief Explanations
- Identify the warmest month by finding the highest point on the temperature line (dashed line with markers) on the climograph.
- Locate the lowest temperature point on the temperature line and read its value.
- Find the shortest precipitation bar (gray bars) to identify the driest month.
- Subtract the coldest month's temperature from the warmest month's temperature.
- Compare the length of time/extent of warm vs. cold temperatures: warm temperatures (needing AC) are higher and last longer than cold ones.
- Temperature ranges from ~70°F to ~90°F, so there are mild seasonal shifts in warmth, not extreme cold.
- Check precipitation levels: most months have moderate precipitation, no extremely heavy, prolonged rain.
- Match the climate (warm summers, mild winters, moderate rainfall) to U.S. city climates: Chicago has this continental temperate climate.

Snap & solve any problem in the app
Get step-by-step solutions on Sovi AI
Photo-based solutions with guided steps
Explore more problems and detailed explanations
- July (the 7th month on the graph)
- ~70°F
- December (the 12th month on the graph)
- $90^\circ\text{F} - 70^\circ\text{F} = 20^\circ\text{F}$
- Air conditioning business. The warmest months reach ~90°F, and most months have average temperatures above 75°F, meaning demand for cooling will be high for most of the year, while cold temperatures (needing heating) are mild and limited.
- Yes, but only for warmth levels. Light, breathable clothing (shorts, t-shirts) for the warmest summer months, and light layers (long sleeves, light jackets) for the milder cooler months; no heavy winter gear is needed.
- No, flooding is not a serious risk. Precipitation levels are moderate year-round, with no months showing extremely high rainfall (the wettest months have ~10 inches, which is not an extreme, sustained level that would cause major flooding).
- Chicago, Illinois