QUESTION IMAGE
Question
name: nc.m4.af.a.1, nc.m4.af.a.2
date:
unit 2 • piecewise functions, composition of functions, and regression
lesson 2.1: piecewise, step, and absolute value functions
practice 2.1: piecewise, step, and absolute value functions
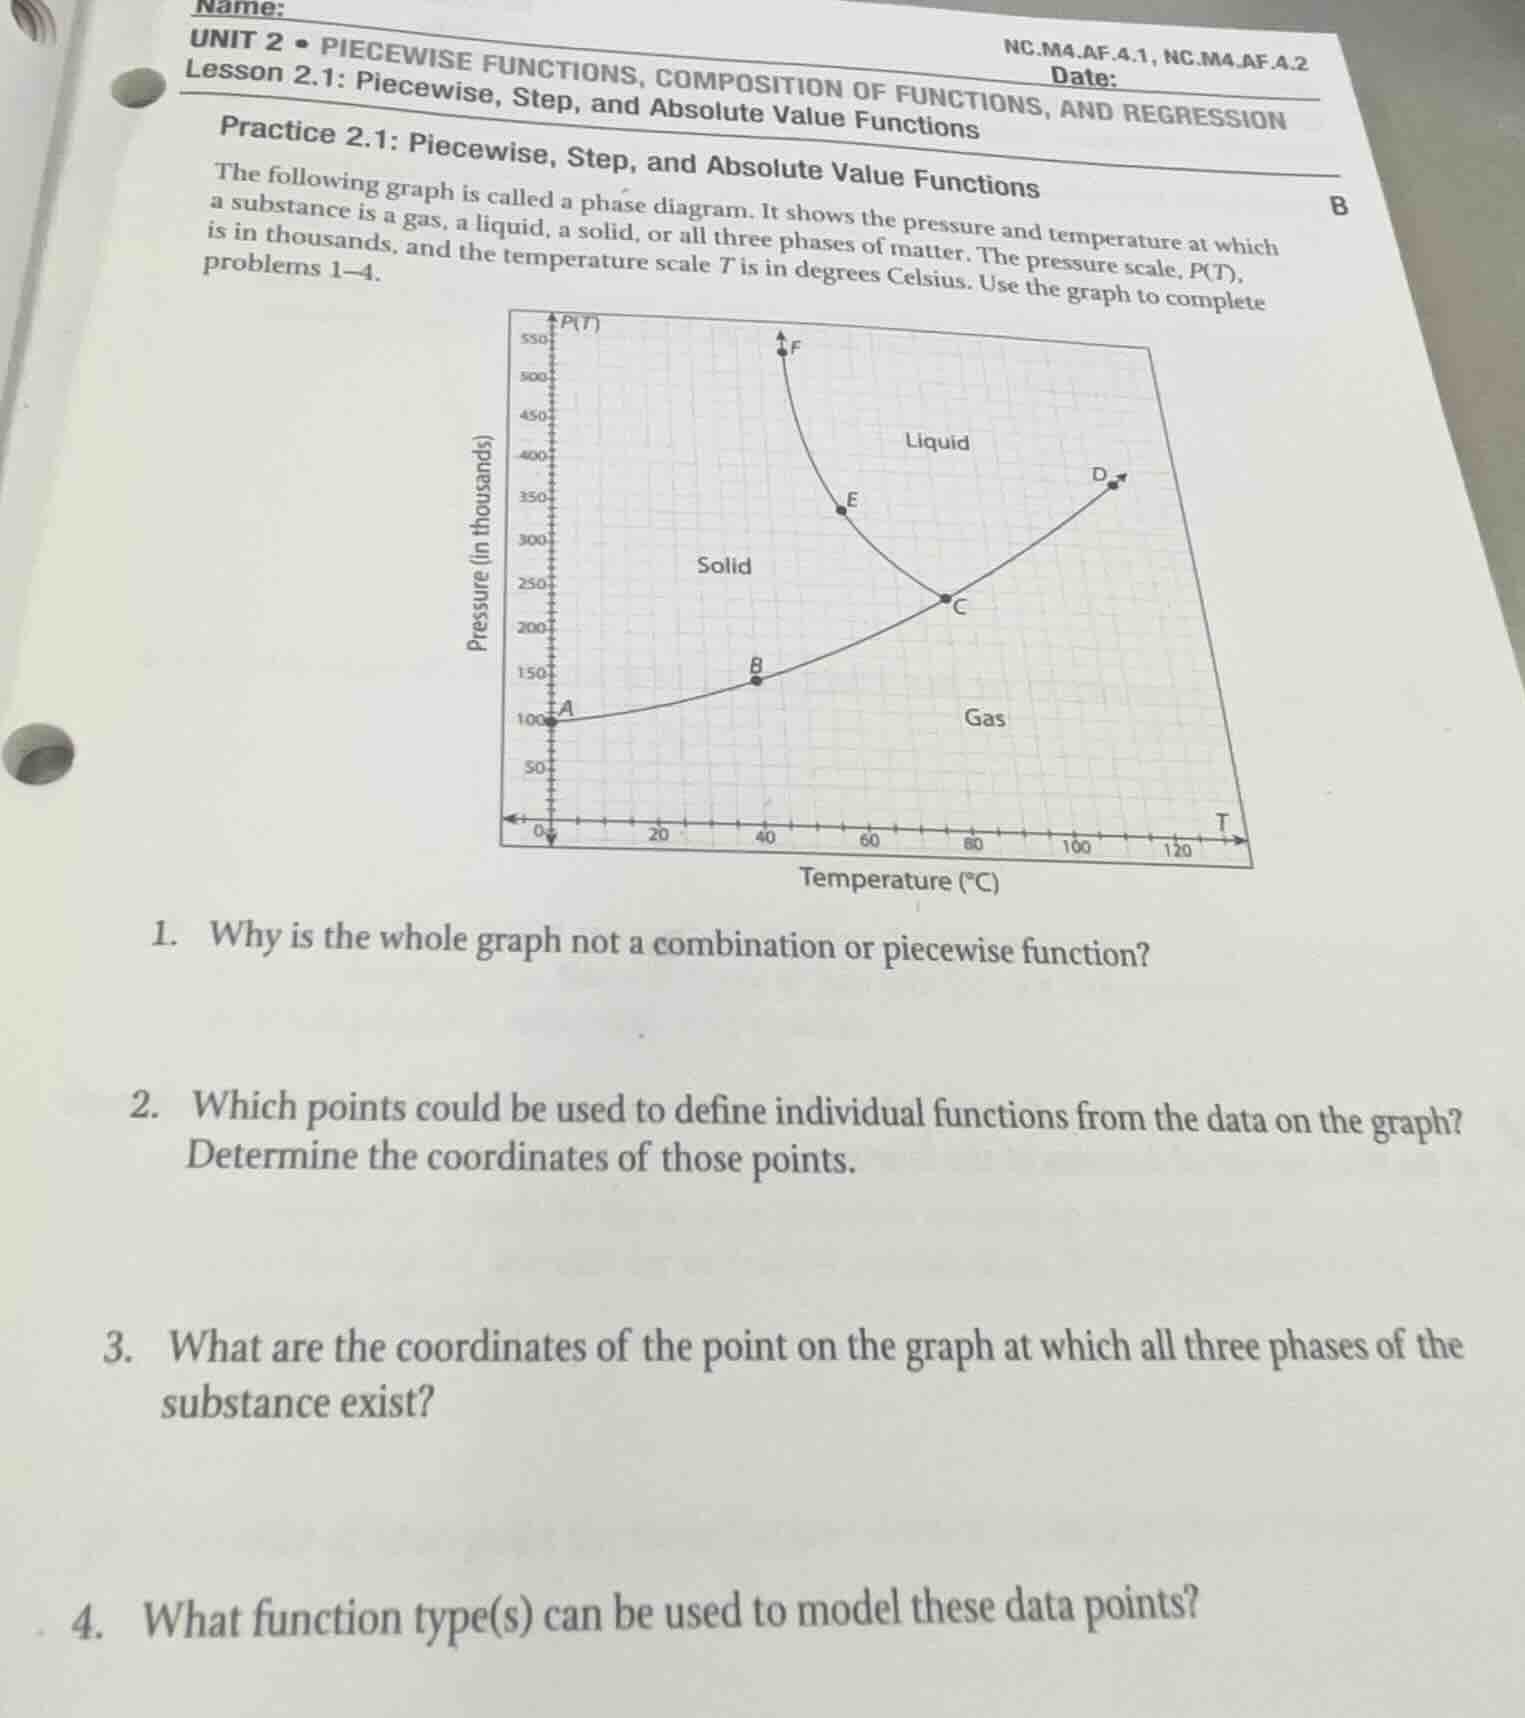
the following graph is called a phase diagram. it shows the pressure and temperature at which a substance is a gas, a liquid, a solid, or all three phases of matter. the pressure scale, p(t), is in thousands, and the temperature scale t is in degrees celsius. use the graph to complete problems 1–4.
graph of phase diagram with pressure (in thousands) on y - axis and temperature (°c) on x - axis, with points a, b, c, d, e, f and regions for solid, liquid, gas
- why is the whole graph not a combination or piecewise function?
- which points could be used to define individual functions from the data on the graph? determine the coordinates of those points.
- what are the coordinates of the point on the graph at which all three phases of the substance exist?
- what function type(s) can be used to model these data points?
- A function requires each input (temperature $T$) to have exactly one output (pressure $P(T)$). For many $T$ values in the phase diagram, there are multiple valid $P(T)$ values (e.g., at $T=80^\circ\text{C}$, pressure can be below, at, or above 225 thousand, corresponding to gas, solid/liquid/gas, or liquid phases). This violates the definition of a function.
- Individual functions are defined by continuous, single-output segments. The segments are $A\to B\to C$, $C\to E\to F$, so their endpoints are the points that define each function segment. Coordinates are read from the graph axes (temperature on x-axis, pressure in thousands on y-axis).
- The point where all three phases coexist is the intersection of all three phase boundary lines, which is point $C$. Its coordinates are read from the graph.
- The segment $A\to B\to C$ has a constant positive slope, matching a linear function. The segment $C\to E\to F$ curves downward with a decreasing slope, matching an exponential (or inverse/non-linear decreasing) function.

Snap & solve any problem in the app
Get step-by-step solutions on Sovi AI
Photo-based solutions with guided steps
Explore more problems and detailed explanations
- It fails the vertical line test: some $T$ values map to multiple $P(T)$ values, violating the function definition.
- The points are $A$, $B$, $C$, $E$, $F$. Their coordinates are:
- $A=(0, 100)$
- $B=(40, 150)$
- $C=(80, 225)$
- $E=(60, 325)$
- $F=(40, 550)$
- $(80, 225)$
- Linear function (for $A\to B\to C$) and exponential/non-linear decreasing function (for $C\to E\to F$)