QUESTION IMAGE
Question
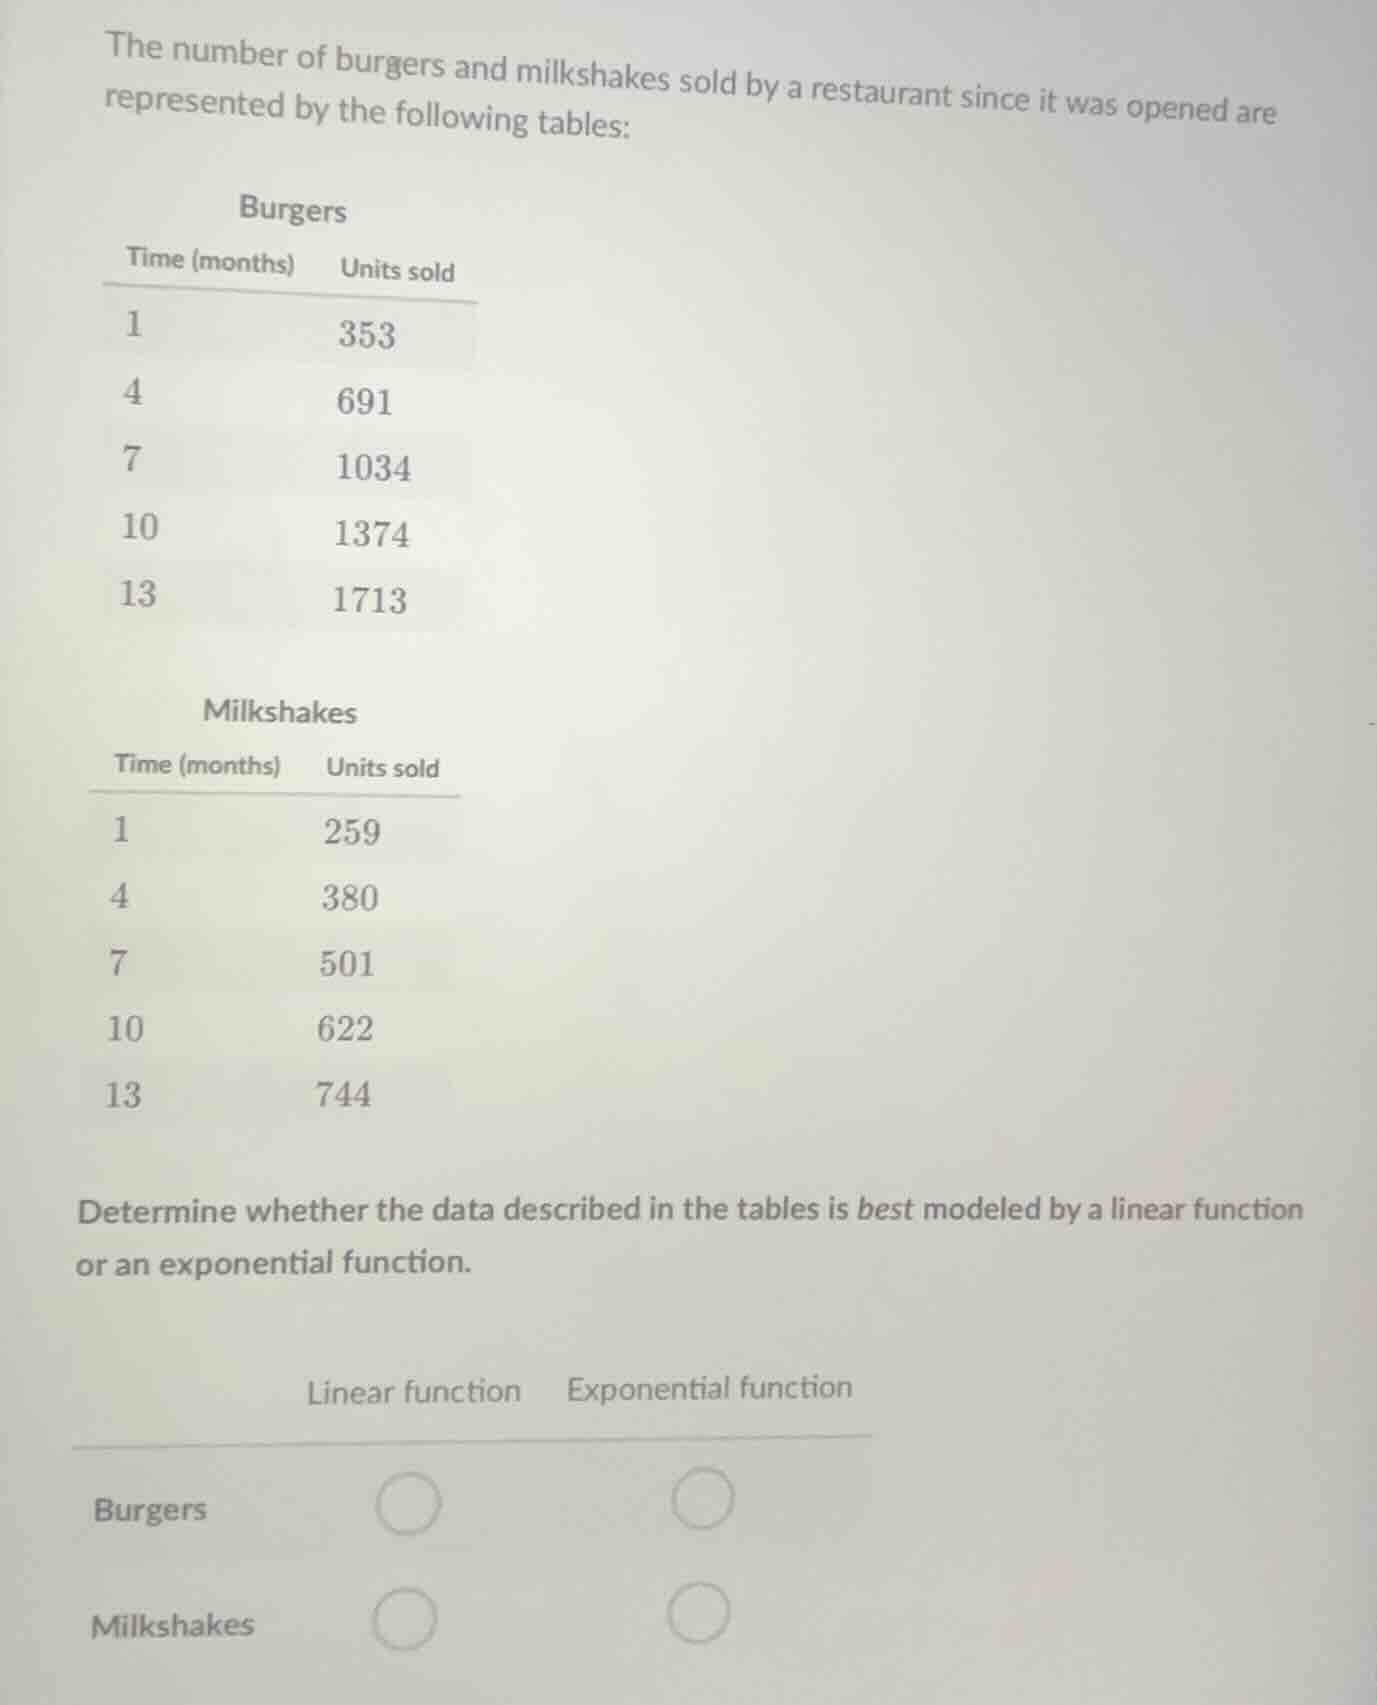
the number of burgers and milkshakes sold by a restaurant since it was opened are represented by the following tables:
burgers
time (months) units sold
1 353
4 691
7 1034
10 1374
13 1713
milkshakes
time (months) units sold
1 259
4 380
7 501
10 622
13 744
determine whether the data described in the tables is best modeled by a linear function or an exponential function.
linear function exponential function
burgers
milkshakes
Step1: Check burger linear differences
Calculate the change in units sold between consecutive time points (time increases by 3 months each interval):
$691 - 353 = 338$
$1034 - 691 = 343$
$1374 - 1034 = 340$
$1713 - 1374 = 339$
Step2: Check burger exponential ratios
Calculate the ratio of units sold for consecutive intervals:
$\frac{691}{353} \approx 1.96$
$\frac{1034}{691} \approx 1.496$
$\frac{1374}{1034} \approx 1.329$
$\frac{1713}{1374} \approx 1.247$
Step3: Check milkshake linear differences
Calculate the change in units sold between consecutive time points:
$380 - 259 = 121$
$501 - 380 = 121$
$622 - 501 = 121$
$744 - 622 = 122$
Step4: Check milkshake exponential ratios
Calculate the ratio of units sold for consecutive intervals:
$\frac{380}{259} \approx 1.467$
$\frac{501}{380} \approx 1.318$
$\frac{622}{501} \approx 1.242$
$\frac{744}{622} \approx 1.196$

Snap & solve any problem in the app
Get step-by-step solutions on Sovi AI
Photo-based solutions with guided steps
Explore more problems and detailed explanations
Burgers: Linear function
Milkshakes: Linear function