QUESTION IMAGE
Question
number of mistakes
20
18
16
14
12
10
8
6
4
2
0
2 4 6 8 10 12 14 16 18 20
number of weeks in class
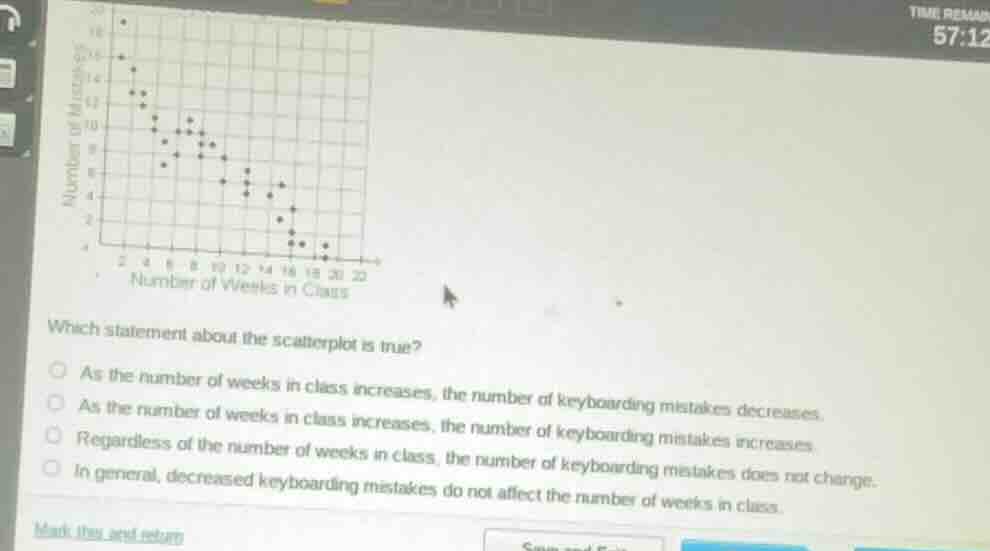
which statement about the scatterplot is true?
as the number of weeks in class increases, the number of keyboarding mistakes decreases.
as the number of weeks in class increases, the number of keyboarding mistakes increases.
regardless of the number of weeks in class, the number of keyboarding mistakes does not change.
in general, decreased keyboarding mistakes do not affect the number of weeks in class.
mark this and return
To determine the correct statement, we analyze the scatterplot's trend. The x - axis represents the number of weeks in class, and the y - axis represents the number of keyboarding mistakes. As the value on the x - axis (weeks in class) increases, the values on the y - axis (mistakes) generally move downward, indicating a negative correlation.
- For the first option: It says "As the number of weeks in class increases, the number of keyboarding mistakes decreases." This matches the negative trend we observe.
- For the second option: It claims that mistakes increase with more weeks, which is the opposite of the trend.
- For the third option: It says mistakes do not change, but we can see a clear downward trend.
- For the fourth option: The statement is about the effect of mistakes on weeks, but the scatterplot shows the effect of weeks on mistakes, and this option misinterprets the relationship.

Snap & solve any problem in the app
Get step-by-step solutions on Sovi AI
Photo-based solutions with guided steps
Explore more problems and detailed explanations
A. As the number of weeks in class increases, the number of keyboarding mistakes decreases.