QUESTION IMAGE
Question
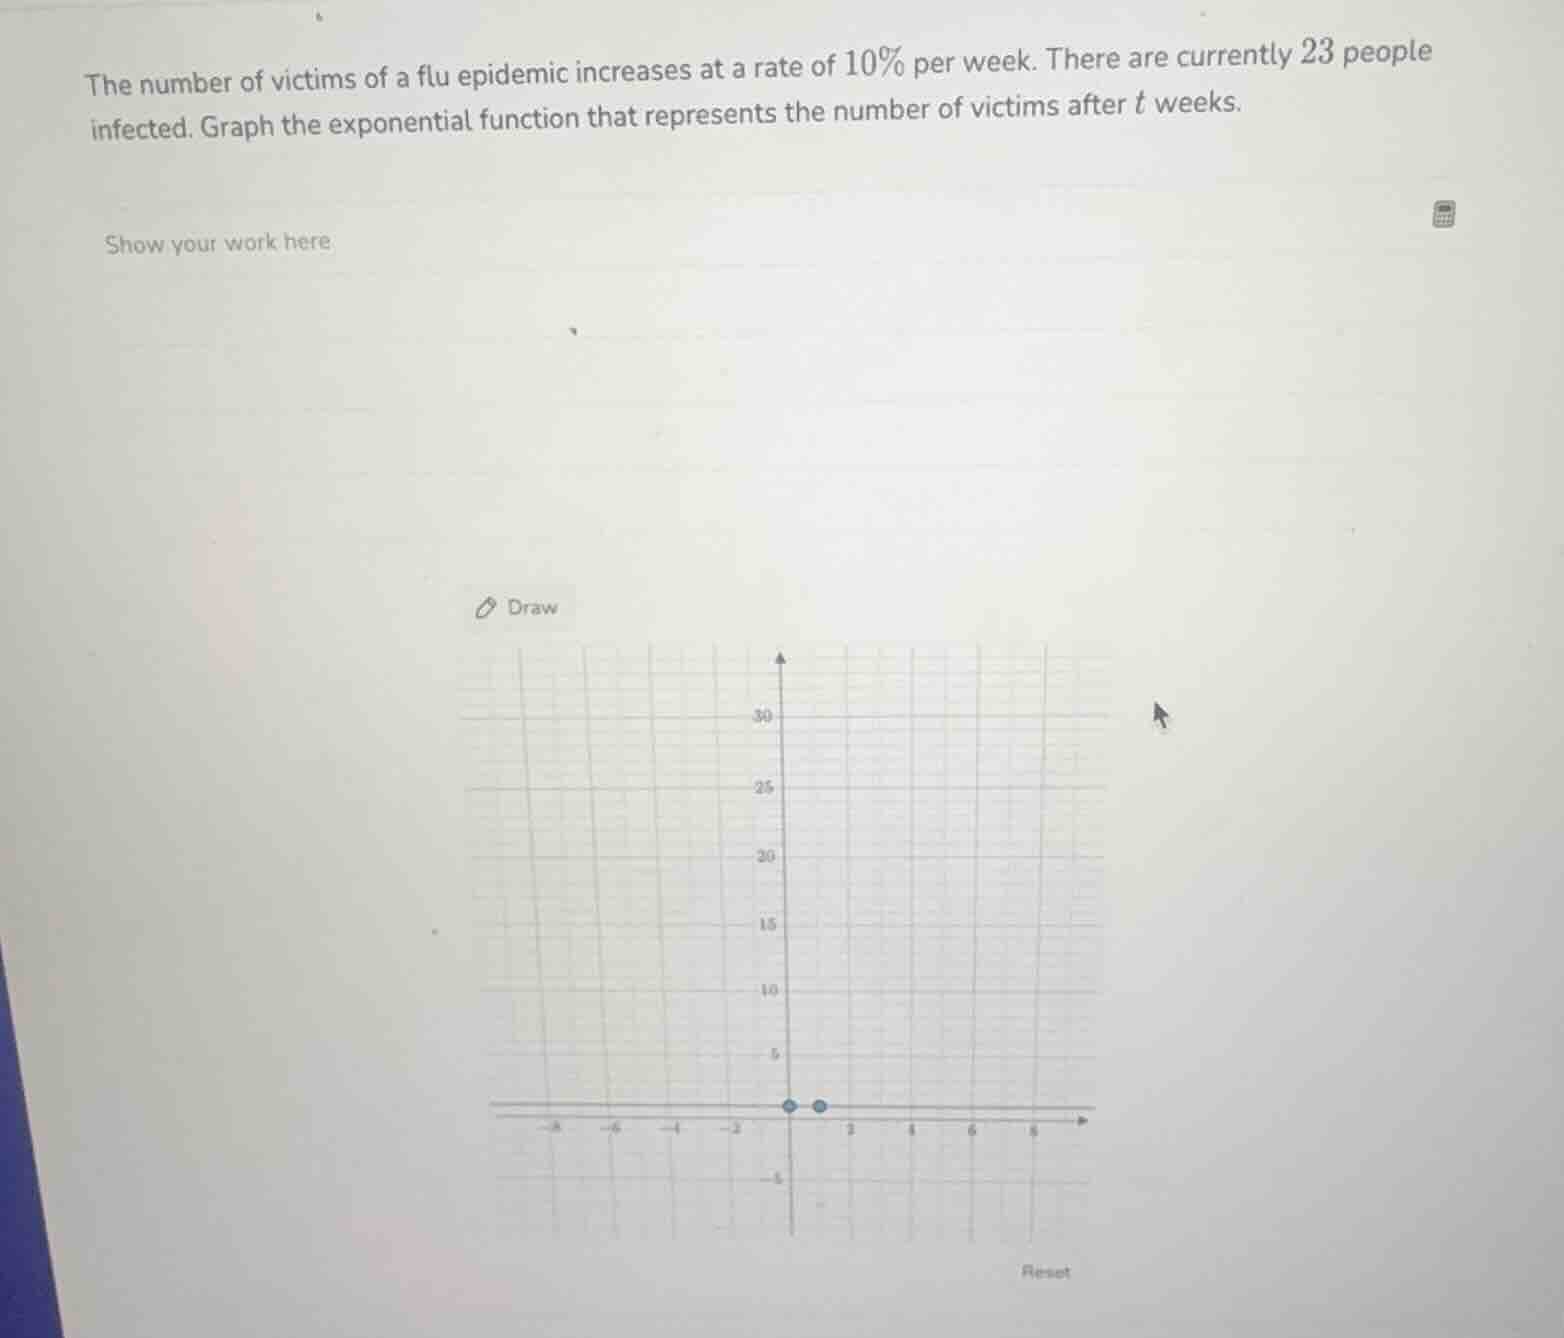
the number of victims of a flu epidemic increases at a rate of 10% per week. there are currently 23 people infected. graph the exponential function that represents the number of victims after $t$ weeks.
show your work here
draw
reset
Step1: Define exponential growth formula
The general exponential growth function is $N(t) = N_0(1+r)^t$, where $N_0$ is the initial number, $r$ is the growth rate, and $t$ is time in weeks.
Step2: Substitute given values
$N_0=23$, $r=0.10$, so $N(t) = 23(1+0.10)^t = 23(1.10)^t$
Step3: Calculate key points
- $t=0$: $N(0)=23(1.10)^0=23$
- $t=1$: $N(1)=23(1.10)^1=25.3$
- $t=2$: $N(2)=23(1.10)^2=27.83$
- $t=3$: $N(3)=23(1.10)^3=30.613$
Step4: Plot and connect points
Plot $(0,23)$, $(1,25.3)$, $(2,27.83)$, $(3,30.613)$ on the graph, then draw a smooth increasing curve through them (only for $t\geq0$, since time cannot be negative).

Snap & solve any problem in the app
Get step-by-step solutions on Sovi AI
Photo-based solutions with guided steps
Explore more problems and detailed explanations
The exponential function is $N(t)=23(1.10)^t$. The graph is a smooth, increasing curve starting at $(0,23)$ and passing through the points $(1,25.3)$, $(2,27.83)$, and $(3,30.613)$, defined only for non-negative values of $t$.