QUESTION IMAGE
Question
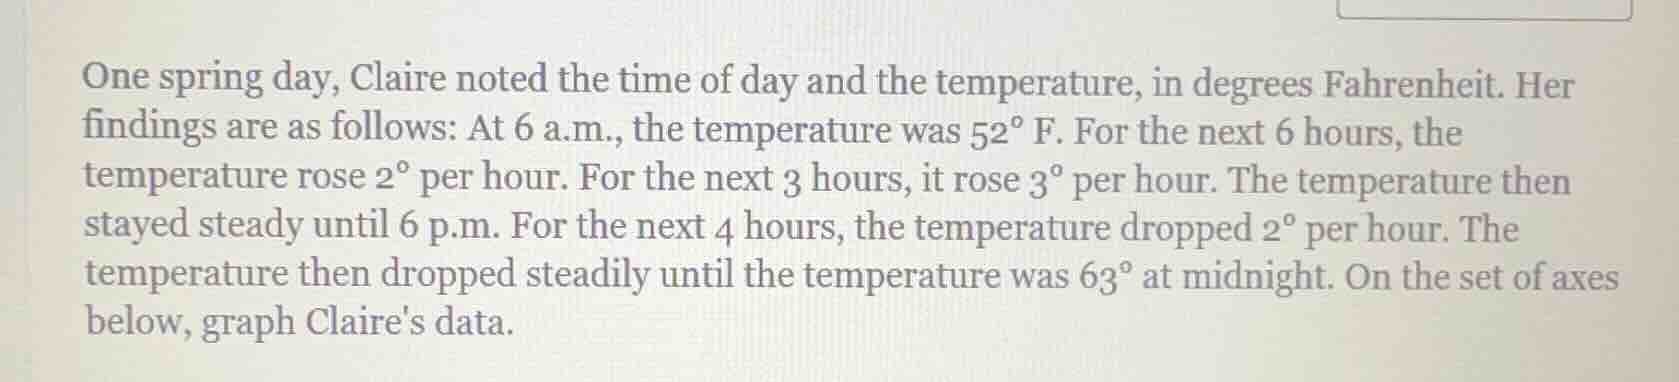
one spring day, claire noted the time of day and the temperature, in degrees fahrenheit. her findings are as follows: at 6 a.m., the temperature was $52^{circ}$ f. for the next 6 hours, the temperature rose $2^{circ}$ per hour. for the next 3 hours, it rose $3^{circ}$ per hour. the temperature then stayed steady until 6 p.m. for the next 4 hours, the temperature dropped $2^{circ}$ per hour. the temperature then dropped steadily until the temperature was $63^{circ}$ at midnight. on the set of axes below, graph claires data.
To graph Claire's temperature data, we first determine the temperature at key times:
Step 1: 6 a.m. to 12 p.m. (noon)
- At 6 a.m., temperature = \( 52^\circ \text{F} \).
- For the next 6 hours (until 12 p.m.), temperature rises \( 2^\circ \) per hour.
Temperature at 12 p.m. = \( 52 + 6 \times 2 = 52 + 12 = 64^\circ \text{F} \).
Step 2: 12 p.m. to 3 p.m.
- For the next 3 hours (until 3 p.m.), temperature rises \( 3^\circ \) per hour.
Temperature at 3 p.m. = \( 64 + 3 \times 3 = 64 + 9 = 73^\circ \text{F} \).
Step 3: 3 p.m. to 6 p.m.
- Temperature stays steady until 6 p.m., so temperature at 6 p.m. = \( 73^\circ \text{F} \).
Step 4: 6 p.m. to 10 p.m.
- For the next 4 hours (until 10 p.m.), temperature drops \( 2^\circ \) per hour.
Temperature at 10 p.m. = \( 73 - 4 \times 2 = 73 - 8 = 65^\circ \text{F} \).
Step 5: 10 p.m. to midnight (12 a.m.)
- Temperature drops from \( 65^\circ \text{F} \) at 10 p.m. to \( 63^\circ \text{F} \) at midnight (2 hours later).
Rate of drop = \( \frac{65 - 63}{2} = 1^\circ \) per hour.
Key Data Points:
| Time | Temperature (\(^\circ \text{F}\)) |
|---|---|
| 12 p.m. | 64 |
| 3 p.m. | 73 |
| 6 p.m. | 73 |
| 10 p.m. | 65 |
| Midnight | 63 |
To graph:
- X - axis: Time (in hours after 6 a.m., or labeled with actual times: 6 a.m., 12 p.m., 3 p.m., 6 p.m., 10 p.m., midnight).
- Y - axis: Temperature (in \(^\circ \text{F}\), from ~50 to 80).
Plot the points:
- (6 a.m., 52), (12 p.m., 64), (3 p.m., 73), (6 p.m., 73), (10 p.m., 65), (midnight, 63).
Connect the points with line segments:
- From 6 a.m. to 12 p.m.: Line with slope \( 2 \) (rising \( 2^\circ \) per hour).
- From 12 p.m. to 3 p.m.: Line with slope \( 3 \) (rising \( 3^\circ \) per hour).
- From 3 p.m. to 6 p.m.: Horizontal line (slope \( 0 \), steady temperature).
- From 6 p.m. to 10 p.m.: Line with slope \( -2 \) (dropping \( 2^\circ \) per hour).
- From 10 p.m. to midnight: Line with slope \( -1 \) (dropping \( 1^\circ \) per hour).
This graph visually represents the temperature changes throughout the day.

Snap & solve any problem in the app
Get step-by-step solutions on Sovi AI
Photo-based solutions with guided steps
Explore more problems and detailed explanations
To graph Claire's temperature data, we first determine the temperature at key times:
Step 1: 6 a.m. to 12 p.m. (noon)
- At 6 a.m., temperature = \( 52^\circ \text{F} \).
- For the next 6 hours (until 12 p.m.), temperature rises \( 2^\circ \) per hour.
Temperature at 12 p.m. = \( 52 + 6 \times 2 = 52 + 12 = 64^\circ \text{F} \).
Step 2: 12 p.m. to 3 p.m.
- For the next 3 hours (until 3 p.m.), temperature rises \( 3^\circ \) per hour.
Temperature at 3 p.m. = \( 64 + 3 \times 3 = 64 + 9 = 73^\circ \text{F} \).
Step 3: 3 p.m. to 6 p.m.
- Temperature stays steady until 6 p.m., so temperature at 6 p.m. = \( 73^\circ \text{F} \).
Step 4: 6 p.m. to 10 p.m.
- For the next 4 hours (until 10 p.m.), temperature drops \( 2^\circ \) per hour.
Temperature at 10 p.m. = \( 73 - 4 \times 2 = 73 - 8 = 65^\circ \text{F} \).
Step 5: 10 p.m. to midnight (12 a.m.)
- Temperature drops from \( 65^\circ \text{F} \) at 10 p.m. to \( 63^\circ \text{F} \) at midnight (2 hours later).
Rate of drop = \( \frac{65 - 63}{2} = 1^\circ \) per hour.
Key Data Points:
| Time | Temperature (\(^\circ \text{F}\)) |
|---|---|
| 12 p.m. | 64 |
| 3 p.m. | 73 |
| 6 p.m. | 73 |
| 10 p.m. | 65 |
| Midnight | 63 |
To graph:
- X - axis: Time (in hours after 6 a.m., or labeled with actual times: 6 a.m., 12 p.m., 3 p.m., 6 p.m., 10 p.m., midnight).
- Y - axis: Temperature (in \(^\circ \text{F}\), from ~50 to 80).
Plot the points:
- (6 a.m., 52), (12 p.m., 64), (3 p.m., 73), (6 p.m., 73), (10 p.m., 65), (midnight, 63).
Connect the points with line segments:
- From 6 a.m. to 12 p.m.: Line with slope \( 2 \) (rising \( 2^\circ \) per hour).
- From 12 p.m. to 3 p.m.: Line with slope \( 3 \) (rising \( 3^\circ \) per hour).
- From 3 p.m. to 6 p.m.: Horizontal line (slope \( 0 \), steady temperature).
- From 6 p.m. to 10 p.m.: Line with slope \( -2 \) (dropping \( 2^\circ \) per hour).
- From 10 p.m. to midnight: Line with slope \( -1 \) (dropping \( 1^\circ \) per hour).
This graph visually represents the temperature changes throughout the day.