QUESTION IMAGE
Question
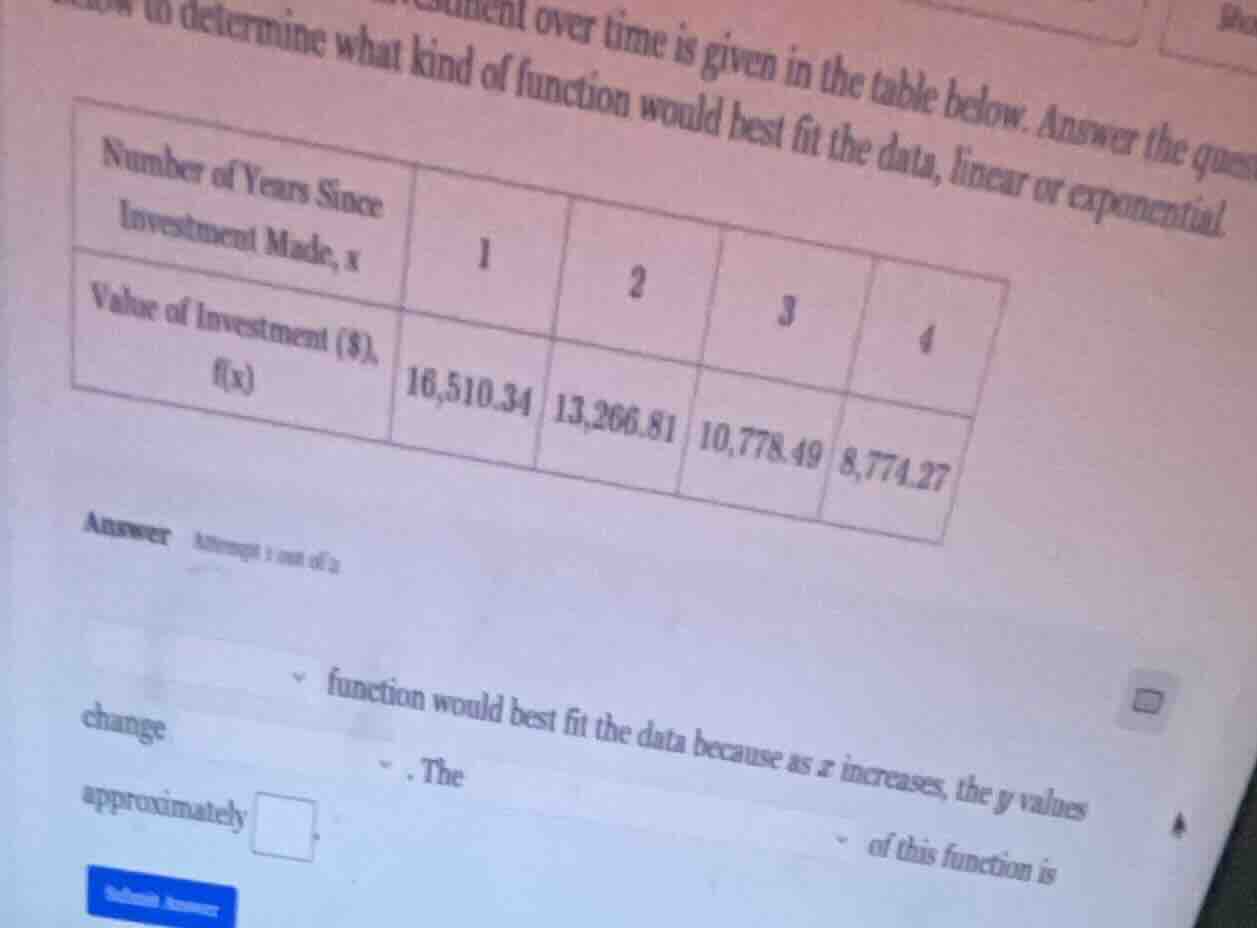
over time is given in the table below. answer the ques to determine what kind of function would best fit the data, linear or exponential.
number of years since investment made, x | 1 | 2 | 3 | 4
value of investment ($), f(x) | 16,510.34 | 13,266.81 | 10,778.49 | 8,774.27
answer attempt 1 out of 2
function would best fit the data because as x increases, the y values change. the of this function is approximately
Step1: Check for linearity (constant difference)
Calculate the differences between consecutive \( f(x) \) values:
- \( 13266.81 - 16510.34 = -3243.53 \)
- \( 10778.49 - 13266.81 = -2488.32 \)
- \( 8774.27 - 10778.49 = -2004.22 \)
The differences are not constant, so not linear.
Step2: Check for exponentiality (constant ratio)
Calculate the ratios between consecutive \( f(x) \) values:
- \( \frac{13266.81}{16510.34} \approx 0.8036 \)
- \( \frac{10778.49}{13266.81} \approx 0.8125 \) (close to 0.8036, slight rounding)
- \( \frac{8774.27}{10778.49} \approx 0.8139 \) (consistent around 0.8)
The ratios are approximately constant, indicating exponential decay.

Snap & solve any problem in the app
Get step-by-step solutions on Sovi AI
Photo-based solutions with guided steps
Explore more problems and detailed explanations
exponential; decrease; ratio; 0.8 (or similar constant ratio)