QUESTION IMAGE
Question
on your own
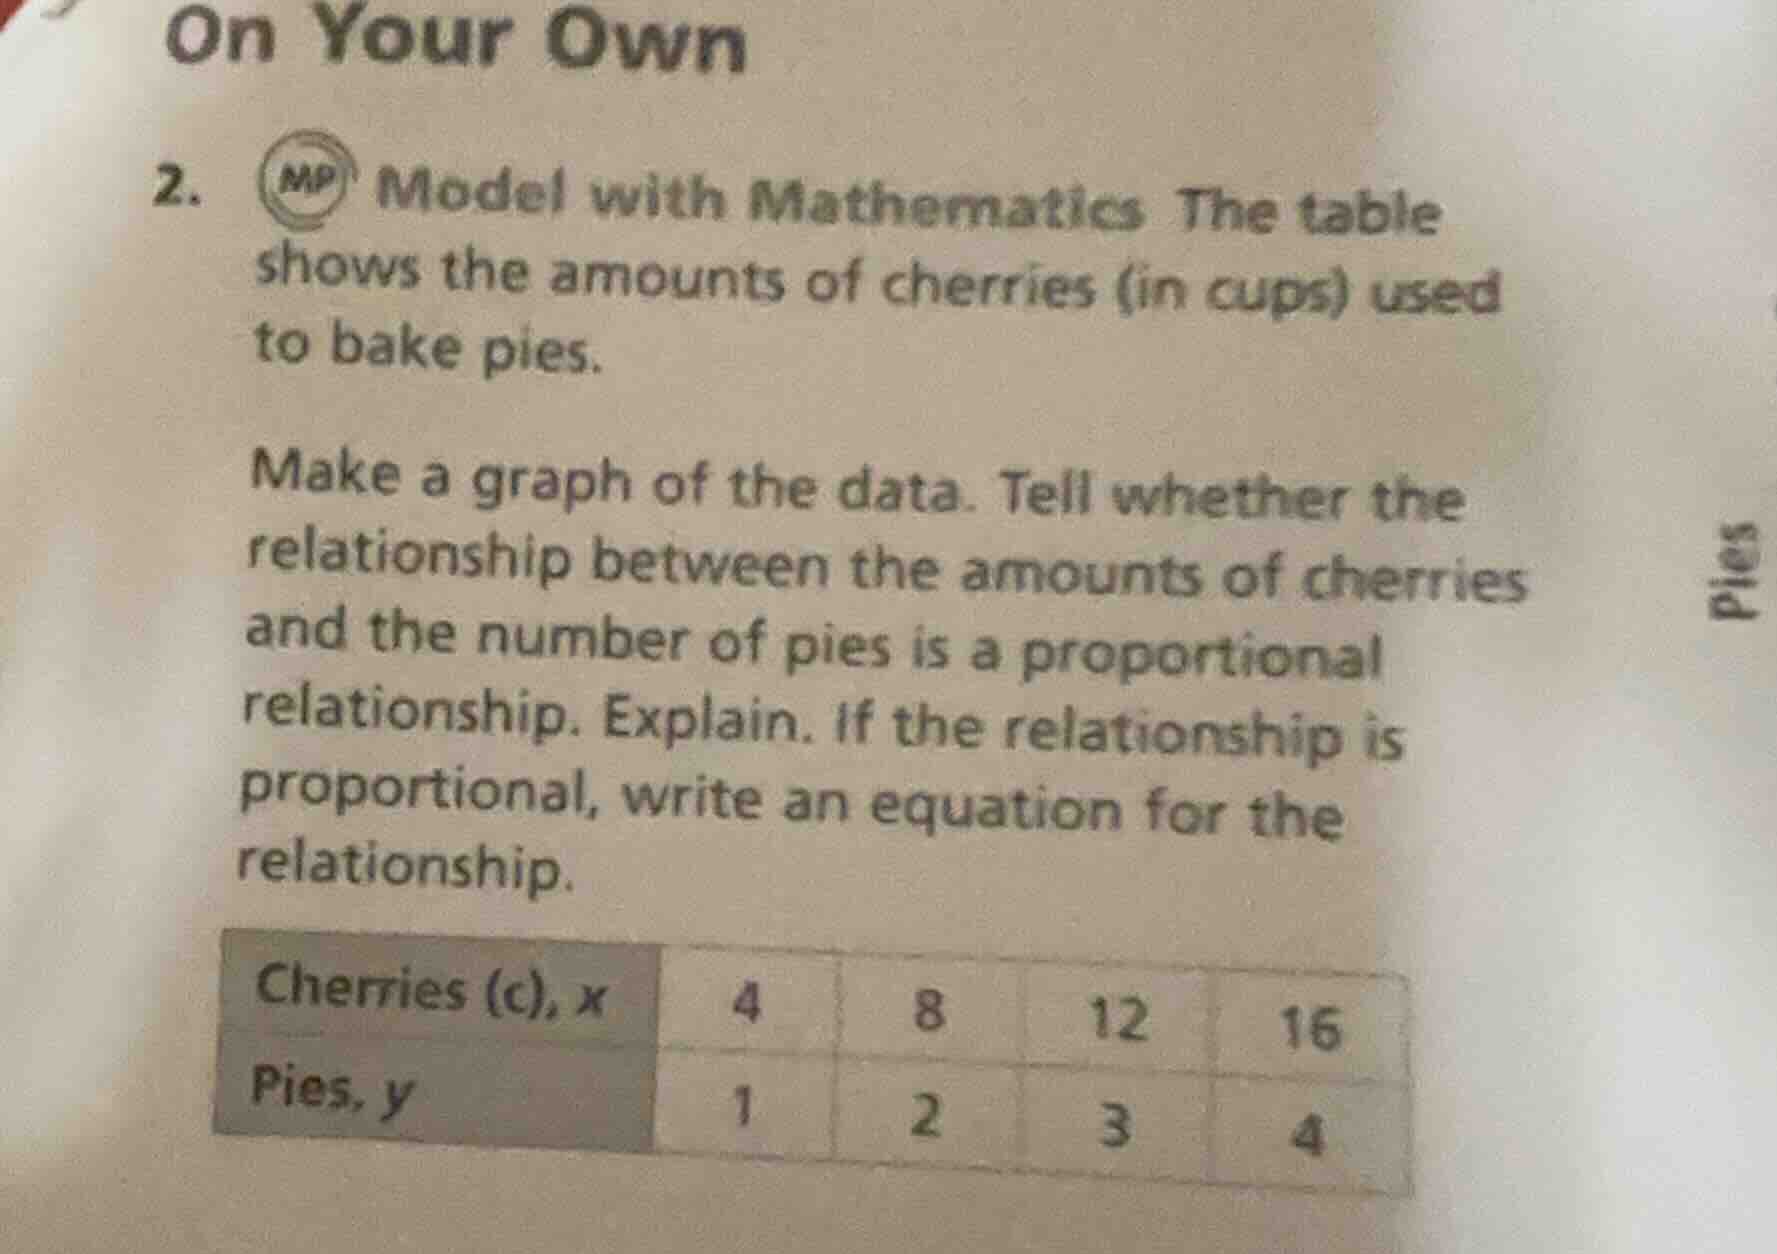
- model with mathematics the table shows the amounts of cherries (in cups) used to bake pies.
make a graph of the data. tell whether the relationship between the amounts of cherries and the number of pies is a proportional relationship. explain. if the relationship is proportional, write an equation for the relationship.
cherries (c), x | 4 | 8 | 12 | 16
pies, y | 1 | 2 | 3 | 4
Step1: Check Proportionality (Ratio)
For each pair \((x,y)\), calculate \(\frac{x}{y}\).
- For \(x = 4, y = 1\): \(\frac{4}{1}=4\)
- For \(x = 8, y = 2\): \(\frac{8}{2}=4\)
- For \(x = 12, y = 3\): \(\frac{12}{3}=4\)
- For \(x = 16, y = 4\): \(\frac{16}{4}=4\)
All ratios are equal (\(4\)), so the relationship is proportional.
Step2: Write the Equation
In a proportional relationship, \(y=\frac{x}{k}\) (or \(x = ky\)) where \(k\) is the constant ratio. Here, \(k = 4\) (from \(\frac{x}{y}=4\) ⇒ \(x = 4y\) ⇒ \(y=\frac{x}{4}\)).

Snap & solve any problem in the app
Get step-by-step solutions on Sovi AI
Photo-based solutions with guided steps
Explore more problems and detailed explanations
The relationship is proportional. The equation is \(y=\frac{1}{4}x\) (or \(x = 4y\)).
(For the graph: Plot points \((4,1)\), \((8,2)\), \((12,3)\), \((16,4)\) on a coordinate plane with \(x\)-axis as cherries and \(y\)-axis as pies. The line passes through the origin, confirming proportionality.)