QUESTION IMAGE
Question
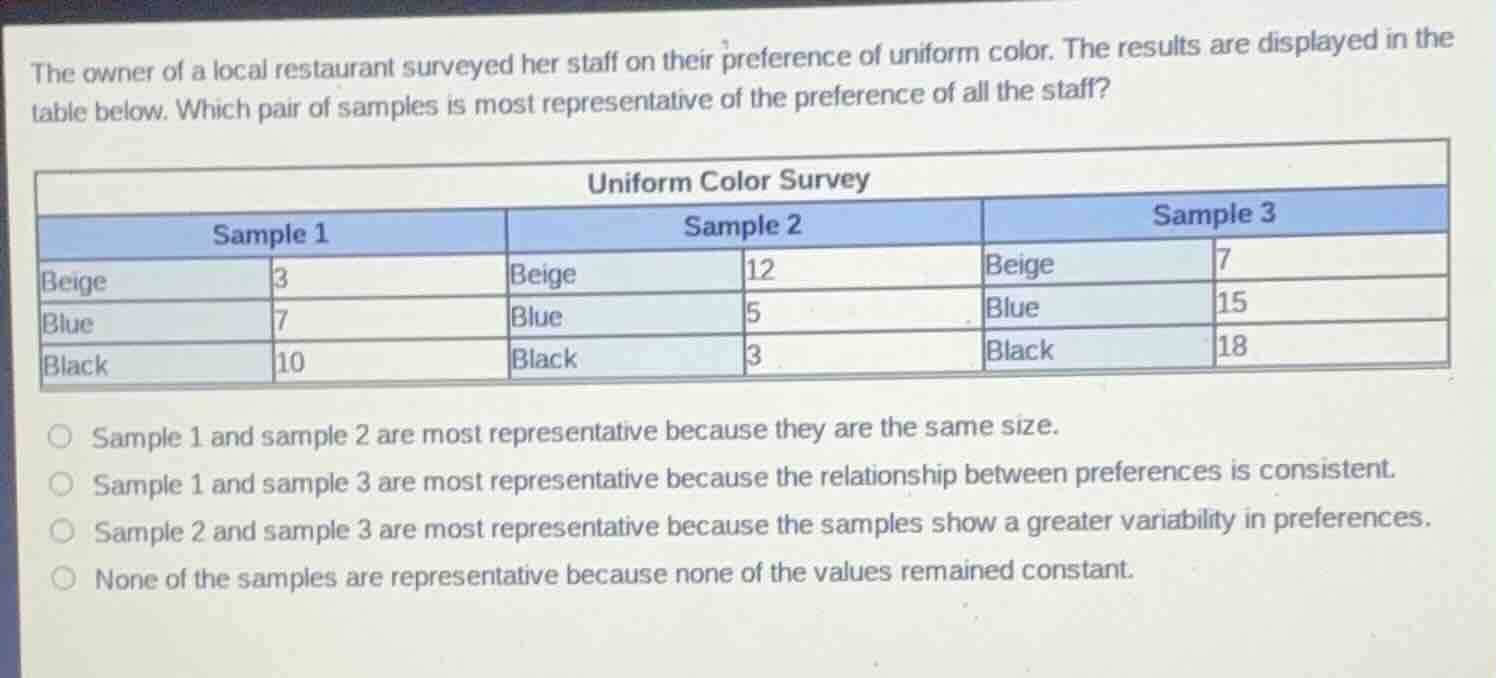
the owner of a local restaurant surveyed her staff on their preference of uniform color. the results are displayed in the table below. which pair of samples is most representative of the preference of all the staff? uniform color survey sample 1 sample 2 sample 3 beige 3 beige 12 beige 7 blue 7 blue 5 blue 15 black 10 black 3 black 18 sample 1 and sample 2 are most representative because they are the same size. sample 1 and sample 3 are most representative because the relationship between preferences is consistent. sample 2 and sample 3 are most representative because the samples show a greater variability in preferences. none of the samples are representative because none of the values remained constant.
Step1: Calculate sample sizes
Sample 1: $3 + 7 + 10 = 20$
Sample 2: $12 + 5 + 3 = 20$
Sample 3: $7 + 15 + 18 = 40$
Step2: Find preference proportions
Sample 1:
Beige: $\frac{3}{20} = 0.15$, Blue: $\frac{7}{20} = 0.35$, Black: $\frac{10}{20} = 0.5$
Sample 2:
Beige: $\frac{12}{20} = 0.6$, Blue: $\frac{5}{20} = 0.25$, Black: $\frac{3}{20} = 0.15$
Sample 3:
Beige: $\frac{7}{40} = 0.175$, Blue: $\frac{15}{40} = 0.375$, Black: $\frac{18}{40} = 0.45$
Step3: Compare proportion consistency
Sample 1 and 3 have consistent order (Black > Blue > Beige) and very close proportions, while Sample 2 has reversed preferences.

Snap & solve any problem in the app
Get step-by-step solutions on Sovi AI
Photo-based solutions with guided steps
Explore more problems and detailed explanations
Sample 1 and sample 3 are most representative because the relationship between preferences is consistent.