QUESTION IMAGE
Question
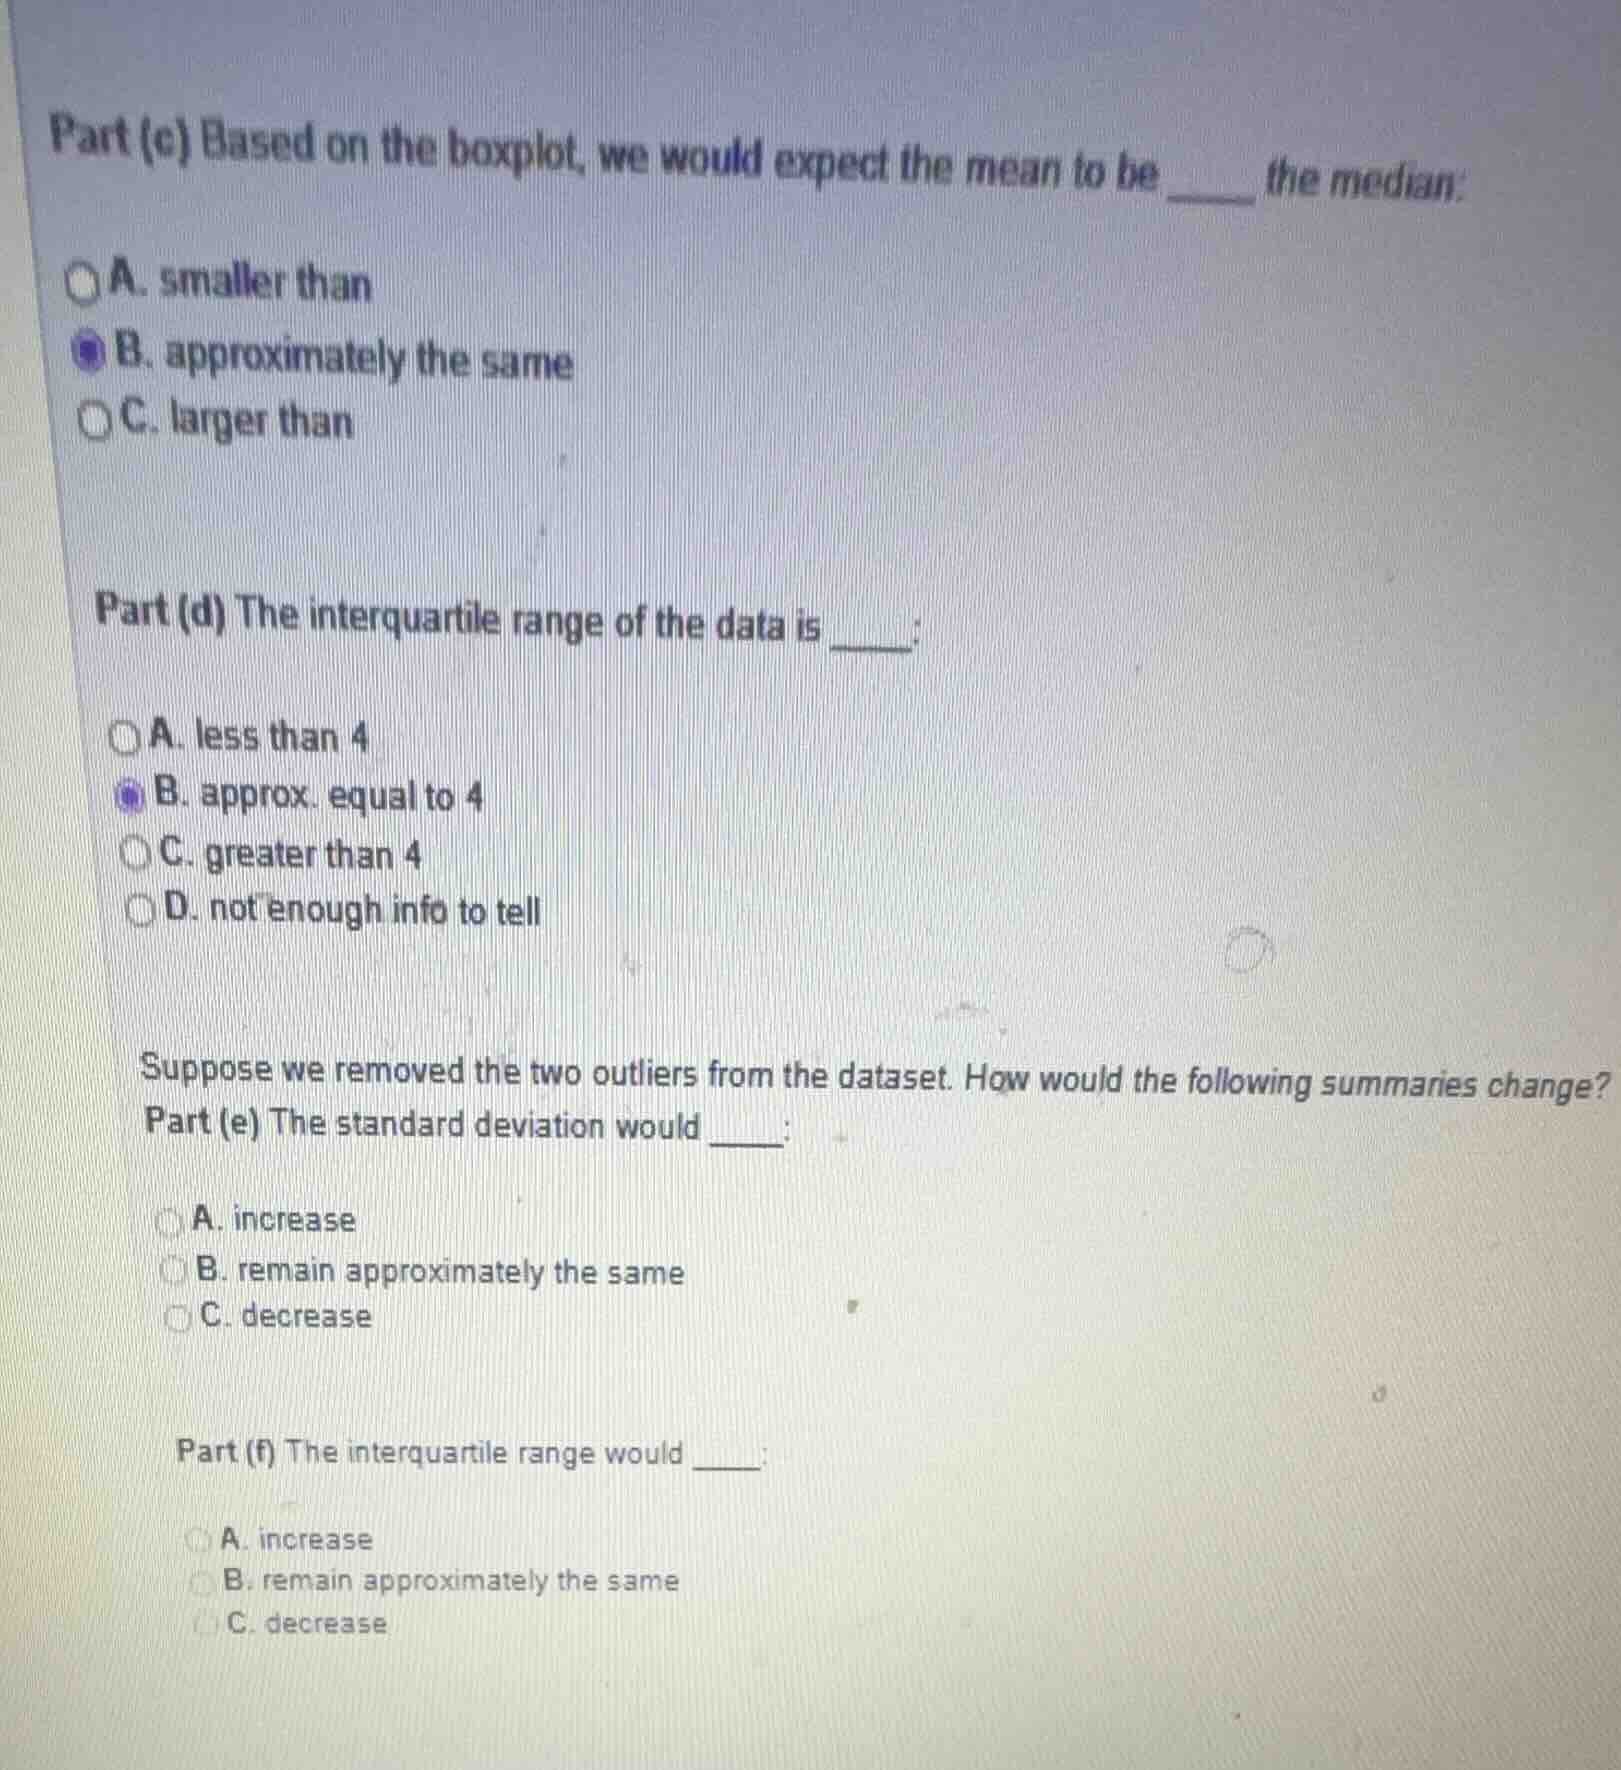
part (c) based on the boxplot, we would expect the mean to be ____ the median.
a. smaller than
b. approximately the same
c. larger than
part (d) the interquartile range of the data is ____:
a. less than 4
b. approx. equal to 4
c. greater than 4
d. not enough info to tell
suppose we removed the two outliers from the dataset. how would the following summaries change?
part (e) the standard deviation would ____:
a. increase
b. remain approximately the same
c. decrease
part (f) the interquartile range would ____:
a. increase
b. remain approximately the same
c. decrease
Part (c)
In a symmetric distribution (implied by boxplot symmetry, though not shown, but the option B is about approximate same), mean and median are close. If the distribution were skewed, mean would differ, but here the expected case for a boxplot with no strong skew (or symmetric) leads to mean ≈ median.
Interquartile range (IQR) is \( Q_3 - Q_1 \). If the option B is "approx. equal to 4", and typical boxplot IQR calculations (without data, but the option suggests this). IQR measures middle 50% spread; if the data's \( Q_3 - Q_1 \approx 4 \), so option B.
Outliers increase standard deviation (SD) as they are far from mean. Removing outliers reduces spread, so SD decreases.

Snap & solve any problem in the app
Get step-by-step solutions on Sovi AI
Photo-based solutions with guided steps
Explore more problems and detailed explanations
B. approximately the same