QUESTION IMAGE
Question
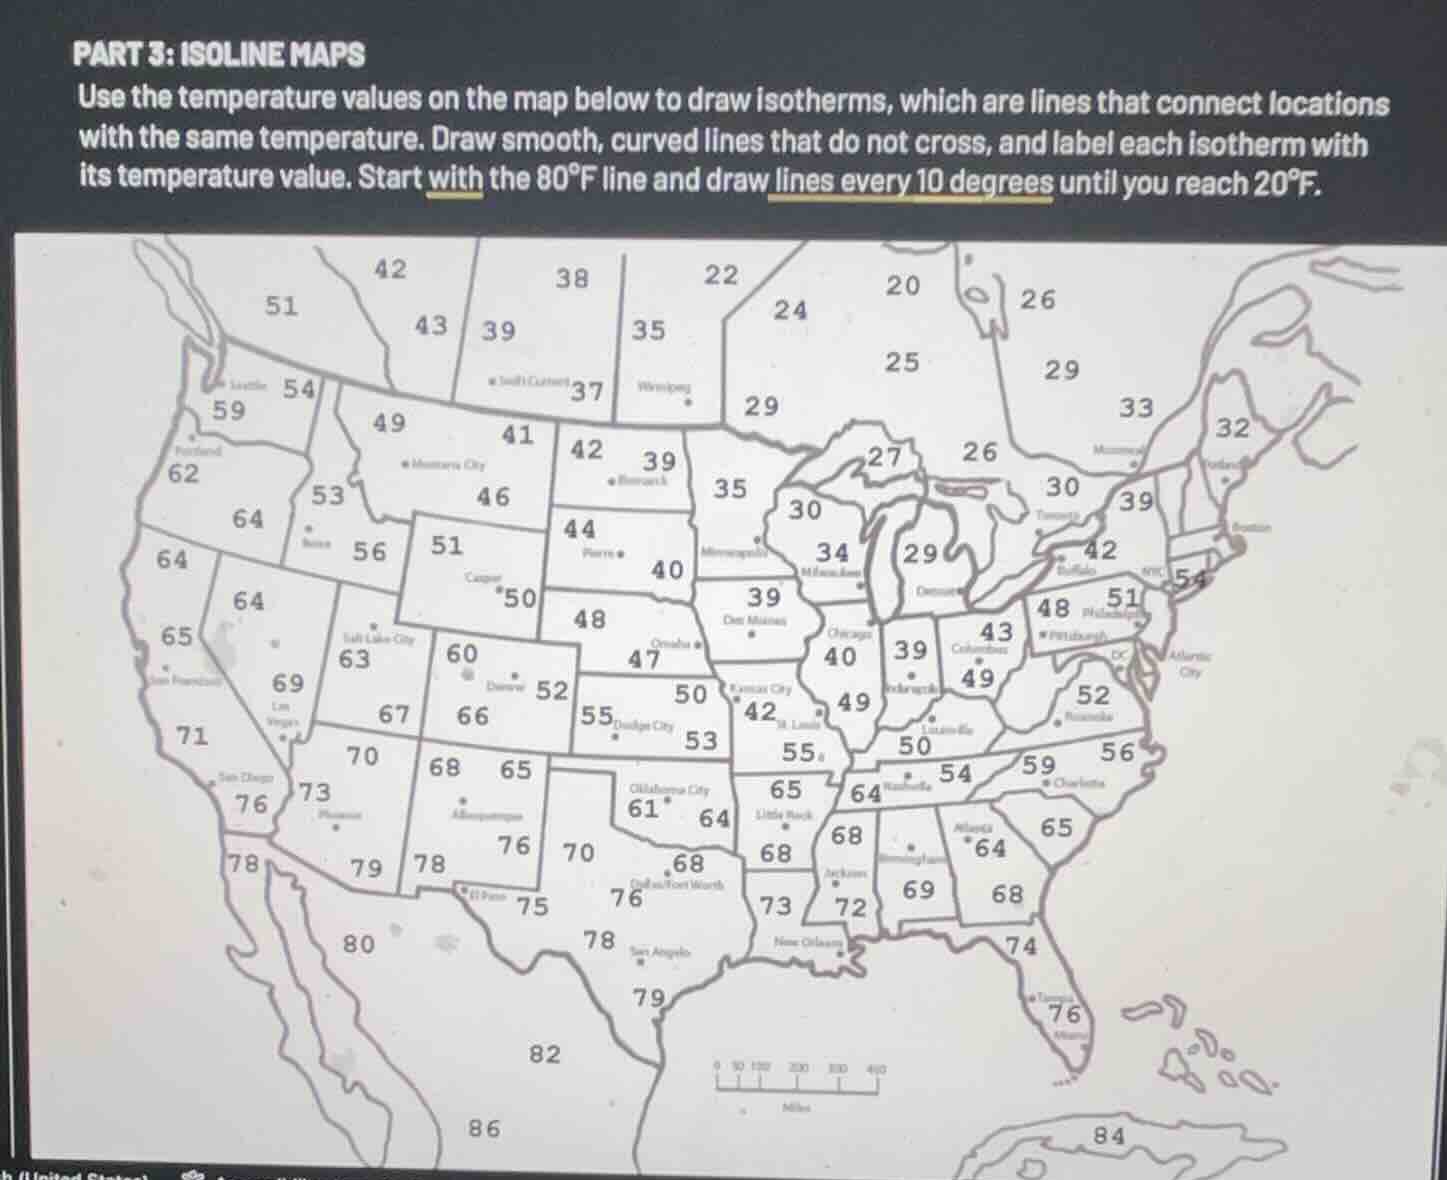
part 3: isoline maps
use the temperature values on the map below to draw isotherms, which are lines that connect locations with the same temperature. draw smooth, curved lines that do not cross, and label each isotherm with its temperature value. start with the 80°f line and draw lines every 10 degrees until you reach 20°f.
Step1: Locate 80°F+ data points
Identify regions with temperatures ≥80°F: Southwest (80, 82, 86, 84).
Step2: Draw 80°F isotherm
Draw a smooth curve enclosing areas with temps ≥80°F, separating them from areas <80°F (e.g., the 79°F point in Arizona). Label this line "80°F".
Step3: Locate 70°F range points
Find areas with temps between 70-79°F (e.g., 70,73,76,78,79). Draw a smooth curve between these and the 80°F line, separating from <70°F areas. Label "70°F".
Step4: Locate 60°F range points
Identify 60-69°F data (e.g., 60,62,64,65,67,69). Draw a curve between 70°F line and <60°F zones. Label "60°F".
Step5: Locate 50°F range points
Find 50-59°F values (e.g., 50,51,52,54,55,56,59). Draw a curve separating these from <50°F areas. Label "50°F".
Step6: Locate 40°F range points
Identify 40-49°F data (e.g., 40,42,43,44,46,48,49). Draw a curve between 50°F line and <40°F zones. Label "40°F".
Step7: Locate 30°F range points
Find 30-39°F values (e.g., 30,32,33,35,37,39). Draw a curve separating these from <30°F areas. Label "30°F".
Step8: Locate 20°F range points
Identify 20-29°F data (e.g., 20,22,24,25,27,29). Draw a curve enclosing these coldest areas. Label "20°F".

Snap & solve any problem in the app
Get step-by-step solutions on Sovi AI
Photo-based solutions with guided steps
Explore more problems and detailed explanations
A set of smooth, non-crossing isotherms labeled 80°F, 70°F, 60°F, 50°F, 40°F, 30°F, and 20°F, each connecting/separating regions with corresponding temperature ranges as mapped from the provided data points.
- 80°F: Curves around the southwest U.S. (covering 80,82,86,84)
- 70°F: Curves between the 80°F zone and the 60-69°F regions
- 60°F: Curves between 70°F zone and 50-59°F regions
- 50°F: Curves between 60°F zone and 40-49°F regions
- 40°F: Curves between 50°F zone and 30-39°F regions
- 30°F: Curves between 40°F zone and 20-29°F regions
- 20°F: Curves around the northernmost cold regions (covering 20,22,24,25,27,29)