QUESTION IMAGE
Question
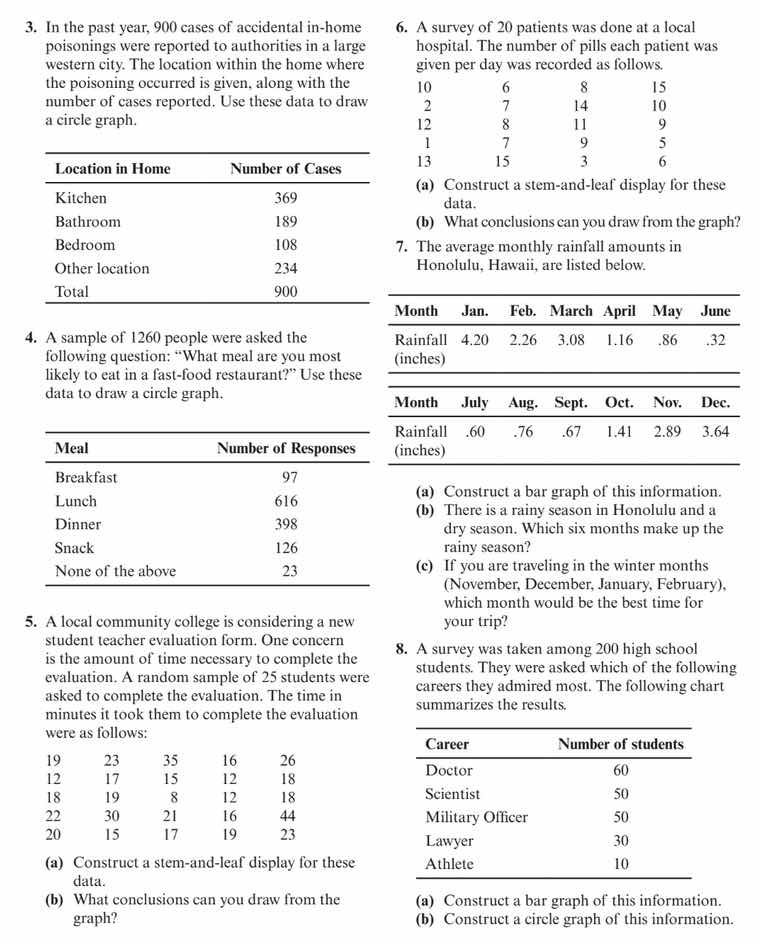
- in the past year, 900 cases of accidental in - home poisonings were reported to authorities in a large western city. the location within the home where the poisoning occurred is given, along with the number of cases reported. use these data to draw a circle graph.
| location in home | number of cases |
|---|---|
| bathroom | 189 |
| bedroom | 108 |
| other location | 234 |
| total | 900 |
- a sample of 1260 people were asked the following question: \what meal are you most likely to eat in a fast - food restaurant?\ use these data to draw a circle graph.
| meal | number of responses |
|---|---|
| lunch | 616 |
| dinner | 398 |
| snack | 126 |
| none of the above | 23 |
- a local community college is considering a new student teacher evaluation form. one concern is the amount of time necessary to complete the evaluation. a random sample of 25 students were asked to complete the evaluation. the time in minutes it took them to complete the evaluation were as follows:
19, 23, 35, 16, 26, 12, 17, 15, 12, 18, 18, 19, 8, 12, 18, 22, 30, 21, 16, 44, 20, 15, 17, 19, 23
(a) construct a stem - and - leaf display for these data.
(b) what conclusions can you draw from the graph?
- a survey of 20 patients was done at a local hospital. the number of pills each patient was given per day was recorded as follows.
10, 6, 8, 15, 2, 7, 14, 10, 12, 8, 11, 9, 1, 7, 9, 5, 13, 15, 3, 6
(a) construct a stem - and - leaf display for these data.
(b) what conclusions can you draw from the graph?
- the average monthly rainfall amounts in honolulu, hawaii, are listed below.
| month | jan. | feb. | march | april | may | june |
|---|---|---|---|---|---|---|
| month | july | aug. | sept. | oct. | nov. | dec. |
| rainfall (inches) | .60 | .76 | .67 | 1.41 | 2.89 | 3.64 |
(a) construct a bar graph of this information.
(b) there is a rainy season in honolulu and a dry season. which six months make up the rainy season?
(c) if you are traveling in the winter months (november, december, january, february), which month would be the best time for your trip?
- a survey was taken among 200 high school students. they were asked which of the following careers they admired most. the following chart summarizes the results.
| career | number of students |
|---|---|
| scientist | 50 |
| military officer | 50 |
| lawyer | 30 |
| athlete | 10 |
(a) construct a bar graph of this information.
(b) construct a circle graph of this information.
Since there are multiple sub - questions, we will use the appropriate solution format for each. Let's start with question 3 (a) (assuming the main task is to construct a circle graph for question 3, and we can use the general method for constructing circle graphs):
Question 3: Construct a circle graph for accidental in - home poisonings
Step - by - Step Explanation:
- Calculate the total number of cases:
The total number of cases is given as \(N = 900\).
- Calculate the percentage for each location:
- For Kitchen: The number of cases \(n_{k}=369\). The percentage \(p_{k}=\frac{369}{900}\times100\% = 41\%\). The central angle \(\theta_{k}=\frac{369}{900}\times360^{\circ}=147.6^{\circ}\)
- For Bathroom: \(n_{b} = 189\). \(p_{b}=\frac{189}{900}\times100\%=21\%\). \(\theta_{b}=\frac{189}{900}\times360^{\circ} = 75.6^{\circ}\)
- For Bedroom: \(n_{r}=108\). \(p_{r}=\frac{108}{900}\times100\% = 12\%\). \(\theta_{r}=\frac{108}{900}\times360^{\circ}=43.2^{\circ}\)
- For Other location: \(n_{o}=234\). \(p_{o}=\frac{234}{900}\times100\%=26\%\). \(\theta_{o}=\frac{234}{900}\times360^{\circ}=93.6^{\circ}\)
- Draw the circle graph:
- Draw a circle.
- Use a protractor to mark the central angles for each category (Kitchen, Bathroom, Bedroom, Other location) calculated above.
- Label each sector with the name of the location and its corresponding percentage.
Question 4: Construct a circle graph for the fast - food meal survey
Step - by - Step Explanation:
- Calculate the total number of responses:
The total number of responses \(N=\ 97 + 616+398 + 126+23=1260\) (which is given, but we can verify it: \(97+616 = 713\), \(713+398=1111\), \(1111 + 126=1237\), \(1237+23 = 1260\))
- Calculate the percentage for each meal:
- Breakfast: \(n_{b}=97\). \(p_{b}=\frac{97}{1260}\times100\%\approx7.7\%\). \(\theta_{b}=\frac{97}{1260}\times360^{\circ}\approx27.7^{\circ}\)
- Lunch: \(n_{l}=616\). \(p_{l}=\frac{616}{1260}\times100\%\approx48.9\%\). \(\theta_{l}=\frac{616}{1260}\times360^{\circ}\approx176.0^{\circ}\)
- Dinner: \(n_{d}=398\). \(p_{d}=\frac{398}{1260}\times100\%\approx31.6\%\). \(\theta_{d}=\frac{398}{1260}\times360^{\circ}\approx113.8^{\circ}\)
- Snack: \(n_{s}=126\). \(p_{s}=\frac{126}{1260}\times100\% = 10\%\). \(\theta_{s}=\frac{126}{1260}\times360^{\circ}=36^{\circ}\)
- None of the above: \(n_{n}=23\). \(p_{n}=\frac{23}{1260}\times100\%\approx1.8\%\). \(\theta_{n}=\frac{23}{1260}\times360^{\circ}\approx6.6^{\circ}\)
- Draw the circle graph:
- Draw a circle.
- Use a protractor to mark the central angles for each meal category.
- Label each sector with the name of the meal and its corresponding percentage.
Question 5 (a): Construct a stem - and - leaf display for the student evaluation time data
Step - by - Step Explanation:
- Identify the stems and leaves:
The data values are: 19, 23, 35, 16, 26, 12, 17, 15, 12, 18, 18, 19, 8, 12, 18, 22, 30, 21, 16, 44, 20, 15, 17, 19, 23
The stem will be the tens digit and the leaf will be the units digit.
Stems: 0, 1, 2, 3, 4
- Stem 0: Leaf 8 (since 8 is a single - digit number, we can consider it as 08)
- Stem 1: Leaves 2, 2, 2, 5, 5, 6, 6, 7, 7, 8, 8, 8, 9, 9, 9 (corresponding to 12, 12, 12, 15, 15, 16, 16, 17, 17, 18, 18, 18, 19, 19, 19)
- Stem 2: Leaves 0, 1, 2, 3, 3, 6 (corresponding to 20, 21, 22, 23, 23, 26)
- Stem 3: Leaves 0, 5 (corresponding to 30, 35)
- Stem 4: Leaf 4 (corresponding to 44)
- Construct the stem - and - leaf display:
| Stem | Leaf |
|------…

Snap & solve any problem in the app
Get step-by-step solutions on Sovi AI
Photo-based solutions with guided steps
Explore more problems and detailed explanations
Since there are multiple sub - questions, we will use the appropriate solution format for each. Let's start with question 3 (a) (assuming the main task is to construct a circle graph for question 3, and we can use the general method for constructing circle graphs):
Question 3: Construct a circle graph for accidental in - home poisonings
Step - by - Step Explanation:
- Calculate the total number of cases:
The total number of cases is given as \(N = 900\).
- Calculate the percentage for each location:
- For Kitchen: The number of cases \(n_{k}=369\). The percentage \(p_{k}=\frac{369}{900}\times100\% = 41\%\). The central angle \(\theta_{k}=\frac{369}{900}\times360^{\circ}=147.6^{\circ}\)
- For Bathroom: \(n_{b} = 189\). \(p_{b}=\frac{189}{900}\times100\%=21\%\). \(\theta_{b}=\frac{189}{900}\times360^{\circ} = 75.6^{\circ}\)
- For Bedroom: \(n_{r}=108\). \(p_{r}=\frac{108}{900}\times100\% = 12\%\). \(\theta_{r}=\frac{108}{900}\times360^{\circ}=43.2^{\circ}\)
- For Other location: \(n_{o}=234\). \(p_{o}=\frac{234}{900}\times100\%=26\%\). \(\theta_{o}=\frac{234}{900}\times360^{\circ}=93.6^{\circ}\)
- Draw the circle graph:
- Draw a circle.
- Use a protractor to mark the central angles for each category (Kitchen, Bathroom, Bedroom, Other location) calculated above.
- Label each sector with the name of the location and its corresponding percentage.
Question 4: Construct a circle graph for the fast - food meal survey
Step - by - Step Explanation:
- Calculate the total number of responses:
The total number of responses \(N=\ 97 + 616+398 + 126+23=1260\) (which is given, but we can verify it: \(97+616 = 713\), \(713+398=1111\), \(1111 + 126=1237\), \(1237+23 = 1260\))
- Calculate the percentage for each meal:
- Breakfast: \(n_{b}=97\). \(p_{b}=\frac{97}{1260}\times100\%\approx7.7\%\). \(\theta_{b}=\frac{97}{1260}\times360^{\circ}\approx27.7^{\circ}\)
- Lunch: \(n_{l}=616\). \(p_{l}=\frac{616}{1260}\times100\%\approx48.9\%\). \(\theta_{l}=\frac{616}{1260}\times360^{\circ}\approx176.0^{\circ}\)
- Dinner: \(n_{d}=398\). \(p_{d}=\frac{398}{1260}\times100\%\approx31.6\%\). \(\theta_{d}=\frac{398}{1260}\times360^{\circ}\approx113.8^{\circ}\)
- Snack: \(n_{s}=126\). \(p_{s}=\frac{126}{1260}\times100\% = 10\%\). \(\theta_{s}=\frac{126}{1260}\times360^{\circ}=36^{\circ}\)
- None of the above: \(n_{n}=23\). \(p_{n}=\frac{23}{1260}\times100\%\approx1.8\%\). \(\theta_{n}=\frac{23}{1260}\times360^{\circ}\approx6.6^{\circ}\)
- Draw the circle graph:
- Draw a circle.
- Use a protractor to mark the central angles for each meal category.
- Label each sector with the name of the meal and its corresponding percentage.
Question 5 (a): Construct a stem - and - leaf display for the student evaluation time data
Step - by - Step Explanation:
- Identify the stems and leaves:
The data values are: 19, 23, 35, 16, 26, 12, 17, 15, 12, 18, 18, 19, 8, 12, 18, 22, 30, 21, 16, 44, 20, 15, 17, 19, 23
The stem will be the tens digit and the leaf will be the units digit.
Stems: 0, 1, 2, 3, 4
- Stem 0: Leaf 8 (since 8 is a single - digit number, we can consider it as 08)
- Stem 1: Leaves 2, 2, 2, 5, 5, 6, 6, 7, 7, 8, 8, 8, 9, 9, 9 (corresponding to 12, 12, 12, 15, 15, 16, 16, 17, 17, 18, 18, 18, 19, 19, 19)
- Stem 2: Leaves 0, 1, 2, 3, 3, 6 (corresponding to 20, 21, 22, 23, 23, 26)
- Stem 3: Leaves 0, 5 (corresponding to 30, 35)
- Stem 4: Leaf 4 (corresponding to 44)
- Construct the stem - and - leaf display:
| Stem | Leaf |
|---|---|
| 1 | 2, 2, 2, 5, 5, 6, 6, 7, 7, 8, 8, 8, 9, 9, 9 |
| 2 | 0, 1, 2, 3, 3, 6 |
| 3 | 0, 5 |
| 4 | 4 |
Question 6 (a): Construct a stem - and - leaf display for the number of pills per day data
The data values are: 10, 6, 8, 15, 12, 7, 14, 10, 12, 8, 11, 9, 1, 7, 9, 5, 13, 15, 3, 6
- Identify stems and leaves:
Stems: 0, 1
- Stem 0: Leaves 1, 3, 5, 6, 6, 7, 7, 8, 8, 9, 9 (corresponding to 1, 3, 5, 6, 6, 7, 7, 8, 8, 9, 9)
- Stem 1: Leaves 0, 0, 1, 2, 2, 3, 4, 5, 5 (corresponding to 10, 10, 11, 12, 12, 13, 14, 15, 15)
- Construct the stem - and - leaf display:
| Stem | Leaf |
|---|---|
| 1 | 0, 0, 1, 2, 2, 3, 4, 5, 5 |
Question 7 (a): Construct a bar graph for Honolulu rainfall
- Identify the variables:
The x - axis will be the month (Jan, Feb, March, April, May, June, July, Aug, Sept, Oct, Nov, Dec) and the y - axis will be the rainfall in inches.
- Draw the bars:
For each month, draw a bar whose height corresponds to the rainfall amount. For example:
- Jan: Height corresponding to 4.20 inches
- Feb: Height corresponding to 2.26 inches
- March: Height corresponding to 3.08 inches
- April: Height corresponding to 1.16 inches
- May: Height corresponding to 0.86 inches
- June: Height corresponding to 0.32 inches
- July: Height corresponding to 0.60 inches
- Aug: Height corresponding to 0.76 inches
- Sept: Height corresponding to 0.67 inches
- Oct: Height corresponding to 1.41 inches
- Nov: Height corresponding to 2.89 inches
- Dec: Height corresponding to 3.64 inches
Question 8 (a): Construct a bar graph for the career survey
- Identify the variables:
The x - axis will be the career (Doctor, Scientist, Military Officer, Lawyer, Athlete) and the y - axis will be the number of students.
- Draw the bars:
- Doctor: Height corresponding to 60 students
- Scientist: Height corresponding to 50 students
- Military Officer: Height corresponding to 50 students
- Lawyer: Height corresponding to 30 students
- Athlete: Height corresponding to 10 students
(Note: For the circle graph construction in questions 4, 8 (b) and the conclusion - drawing parts in questions 5 (b), 6 (b), 7 (b), 8 (b), we can follow similar logical steps. For example, in question 7 (b), to determine the rainy season, we can look at the months with higher rainfall. November (2.89), December (3.64), January (4.20), February (2.26), March (3.08) and October (1.41) have relatively higher rainfall compared to the other months. So the rainy season is likely October - March (or November - April, depending on the threshold).)
Since the question is a collection of multiple sub - questions, and we have provided the construction methods for the main types of graphs (circle, stem - and - leaf, bar) as above. If you need more detailed answers for specific sub - questions (such as the conclusion - drawing parts), please let me know and I will provide more in - depth analysis.