QUESTION IMAGE
Question
period 2nd
graphing practice
for each research project described below, draw the appropriate graph (line vs. bar), label all axes, create a title, and answer the questions.
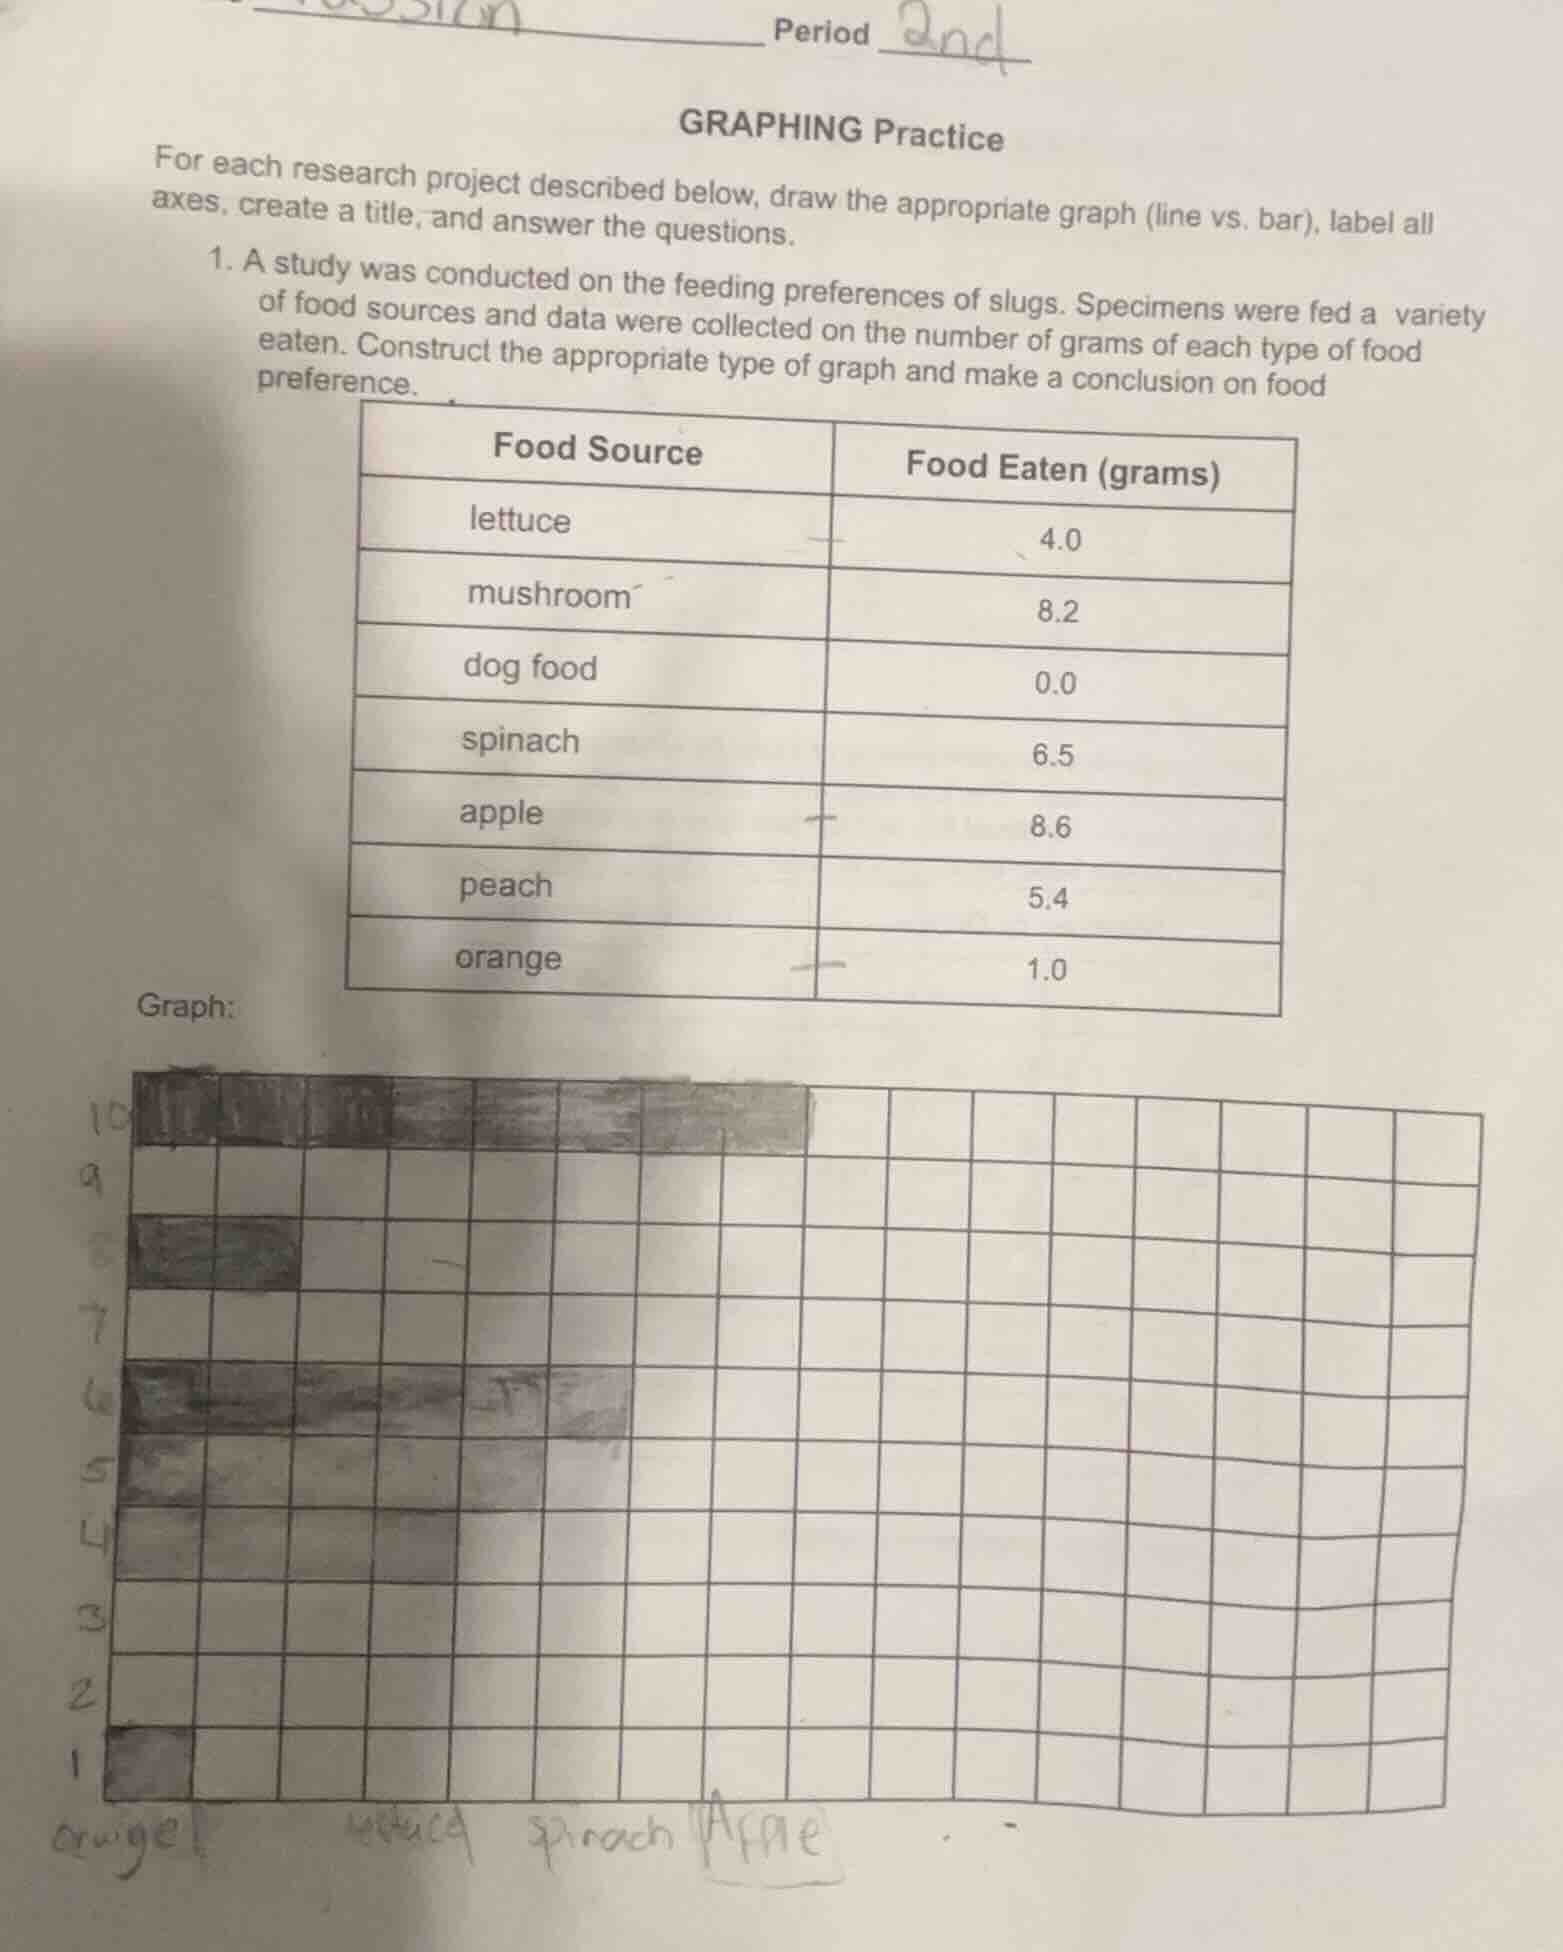
- a study was conducted on the feeding preferences of slugs. specimens were fed a variety of food sources and data were collected on the number of grams of each type of food eaten. construct the appropriate type of graph and make a conclusion on food preference.
food source | food eaten (grams)
lettuce | 4.0
mushroom | 8.2
dog food | 0.0
spinach | 6.5
apple | 8.6
peach | 5.4
orange | 1.0
graph:
grid graph with some bars drawn and labels like orange, lettuce, spinach, apple
Step1: Determine Graph Type
We are comparing different food sources (categorical data) with the amount of food eaten (numerical data). A bar graph is appropriate for comparing categories, so we'll use a bar graph.
Step2: Label Axes and Title
- X - axis: Label with "Food Source" (categories: lettuce, mushroom, dog food, spinach, apple, peach, orange).
- Y - axis: Label with "Food Eaten (grams)" (scale from 0 to 10, since the maximum value is 8.6).
- Title: "Feeding Preferences of Slugs: Grams of Food Eaten"
Step3: Draw Bars
For each food source, draw a bar whose height corresponds to the "Food Eaten (grams)" value:
- Lettuce: height at 4.0
- Mushroom: height at 8.2
- Dog food: height at 0.0
- Spinach: height at 6.5
- Apple: height at 8.6
- Peach: height at 5.4
- Orange: height at 1.0
Step4: Conclusion
By looking at the heights of the bars, we can see that the apple was eaten the most (8.6 grams) and dog food was eaten the least (0.0 grams). Slugs seem to prefer fruits (apple, mushroom - though mushroom is a fungus, apple, peach) and leafy greens (spinach, lettuce) more than dog food or orange.

Snap & solve any problem in the app
Get step-by-step solutions on Sovi AI
Photo-based solutions with guided steps
Explore more problems and detailed explanations
Graph Construction:
- Type: Bar Graph
- X - axis: Food Source (lettuce, mushroom, dog food, spinach, apple, peach, orange)
- Y - axis: Food Eaten (grams) (scale 0 - 10)
- Title: "Feeding Preferences of Slugs: Grams of Food Eaten"
- Bars: Heights as per data (lettuce: 4.0, mushroom: 8.2, dog food: 0.0, spinach: 6.5, apple: 8.6, peach: 5.4, orange: 1.0)
Conclusion:
Slugs ate the most apple (8.6 grams) and the least dog food (0.0 grams). They show a preference for fruits (apple, peach), mushrooms, and leafy greens (spinach, lettuce) over dog food and orange.