QUESTION IMAGE
Question
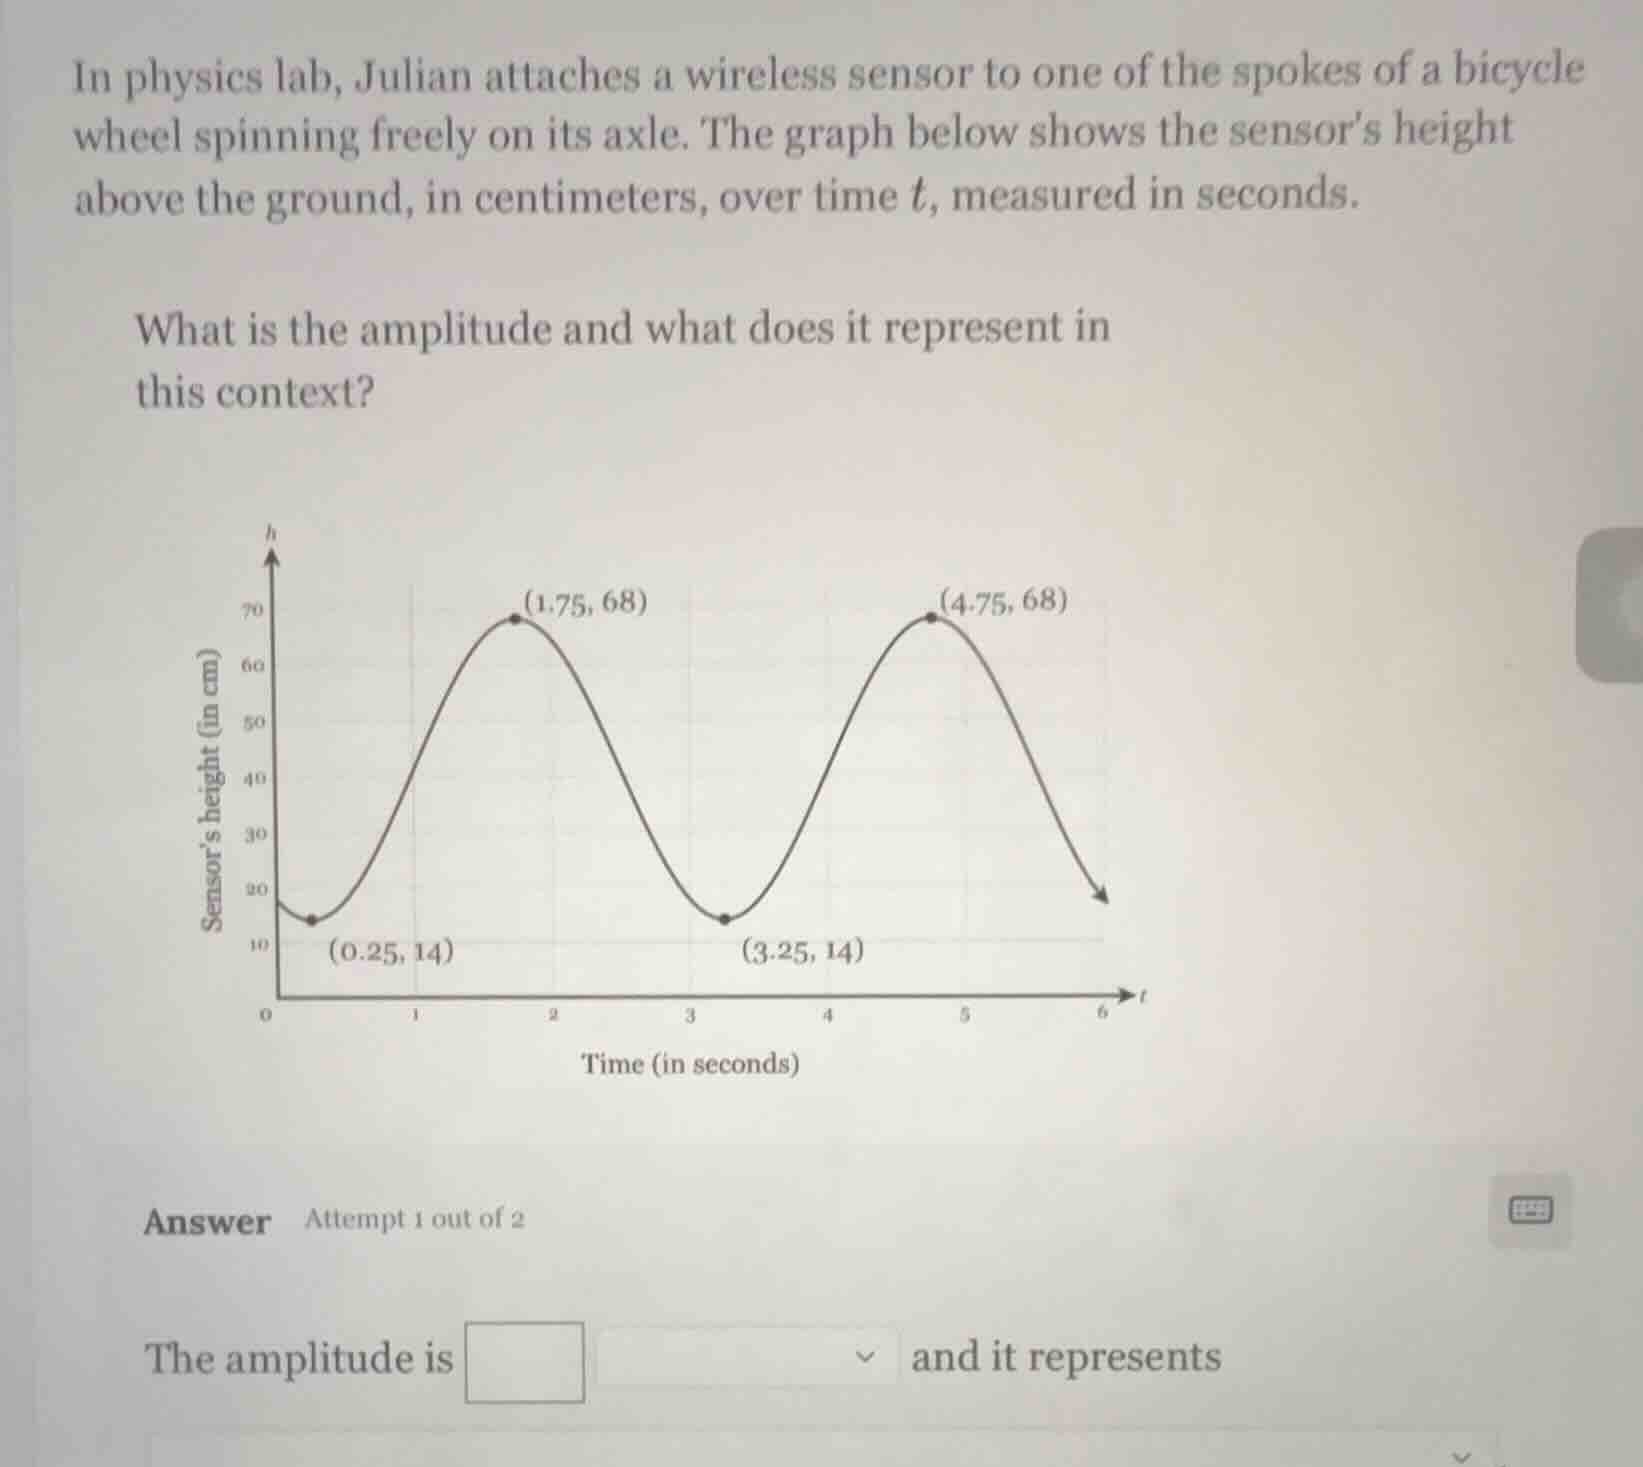
in physics lab, julian attaches a wireless sensor to one of the spokes of a bicycle wheel spinning freely on its axle. the graph below shows the sensor’s height above the ground, in centimeters, over time t, measured in seconds. what is the amplitude and what does it represent in this context? the graph has a vertical axis labeled sensor’s height (in cm) with values from 0 to 70, and a horizontal axis labeled time (in seconds) with values from 0 to 6. key points on the graph are (0.25, 14), (1.75, 68), (3.25, 14), and (4.75, 68).
Step1: Identify max and min height
Max height $h_{max}=68$ cm, Min height $h_{min}=14$ cm
Step2: Calculate amplitude
Amplitude = $\frac{h_{max}-h_{min}}{2}$ = $\frac{68-14}{2}$ = $\frac{54}{2}$ = 27
Step3: Interpret the amplitude
The amplitude is half the total vertical range of the sensor's motion, so it equals the radius of the bicycle wheel (since the wheel's radius is the distance from the axle to the spoke, which is half the distance between the highest and lowest points of the sensor).

Snap & solve any problem in the app
Get step-by-step solutions on Sovi AI
Photo-based solutions with guided steps
Explore more problems and detailed explanations
The amplitude is 27 centimeters, and it represents the radius of the bicycle wheel (the distance from the wheel's axle to the tip of the spoke where the sensor is attached).