QUESTION IMAGE
Question
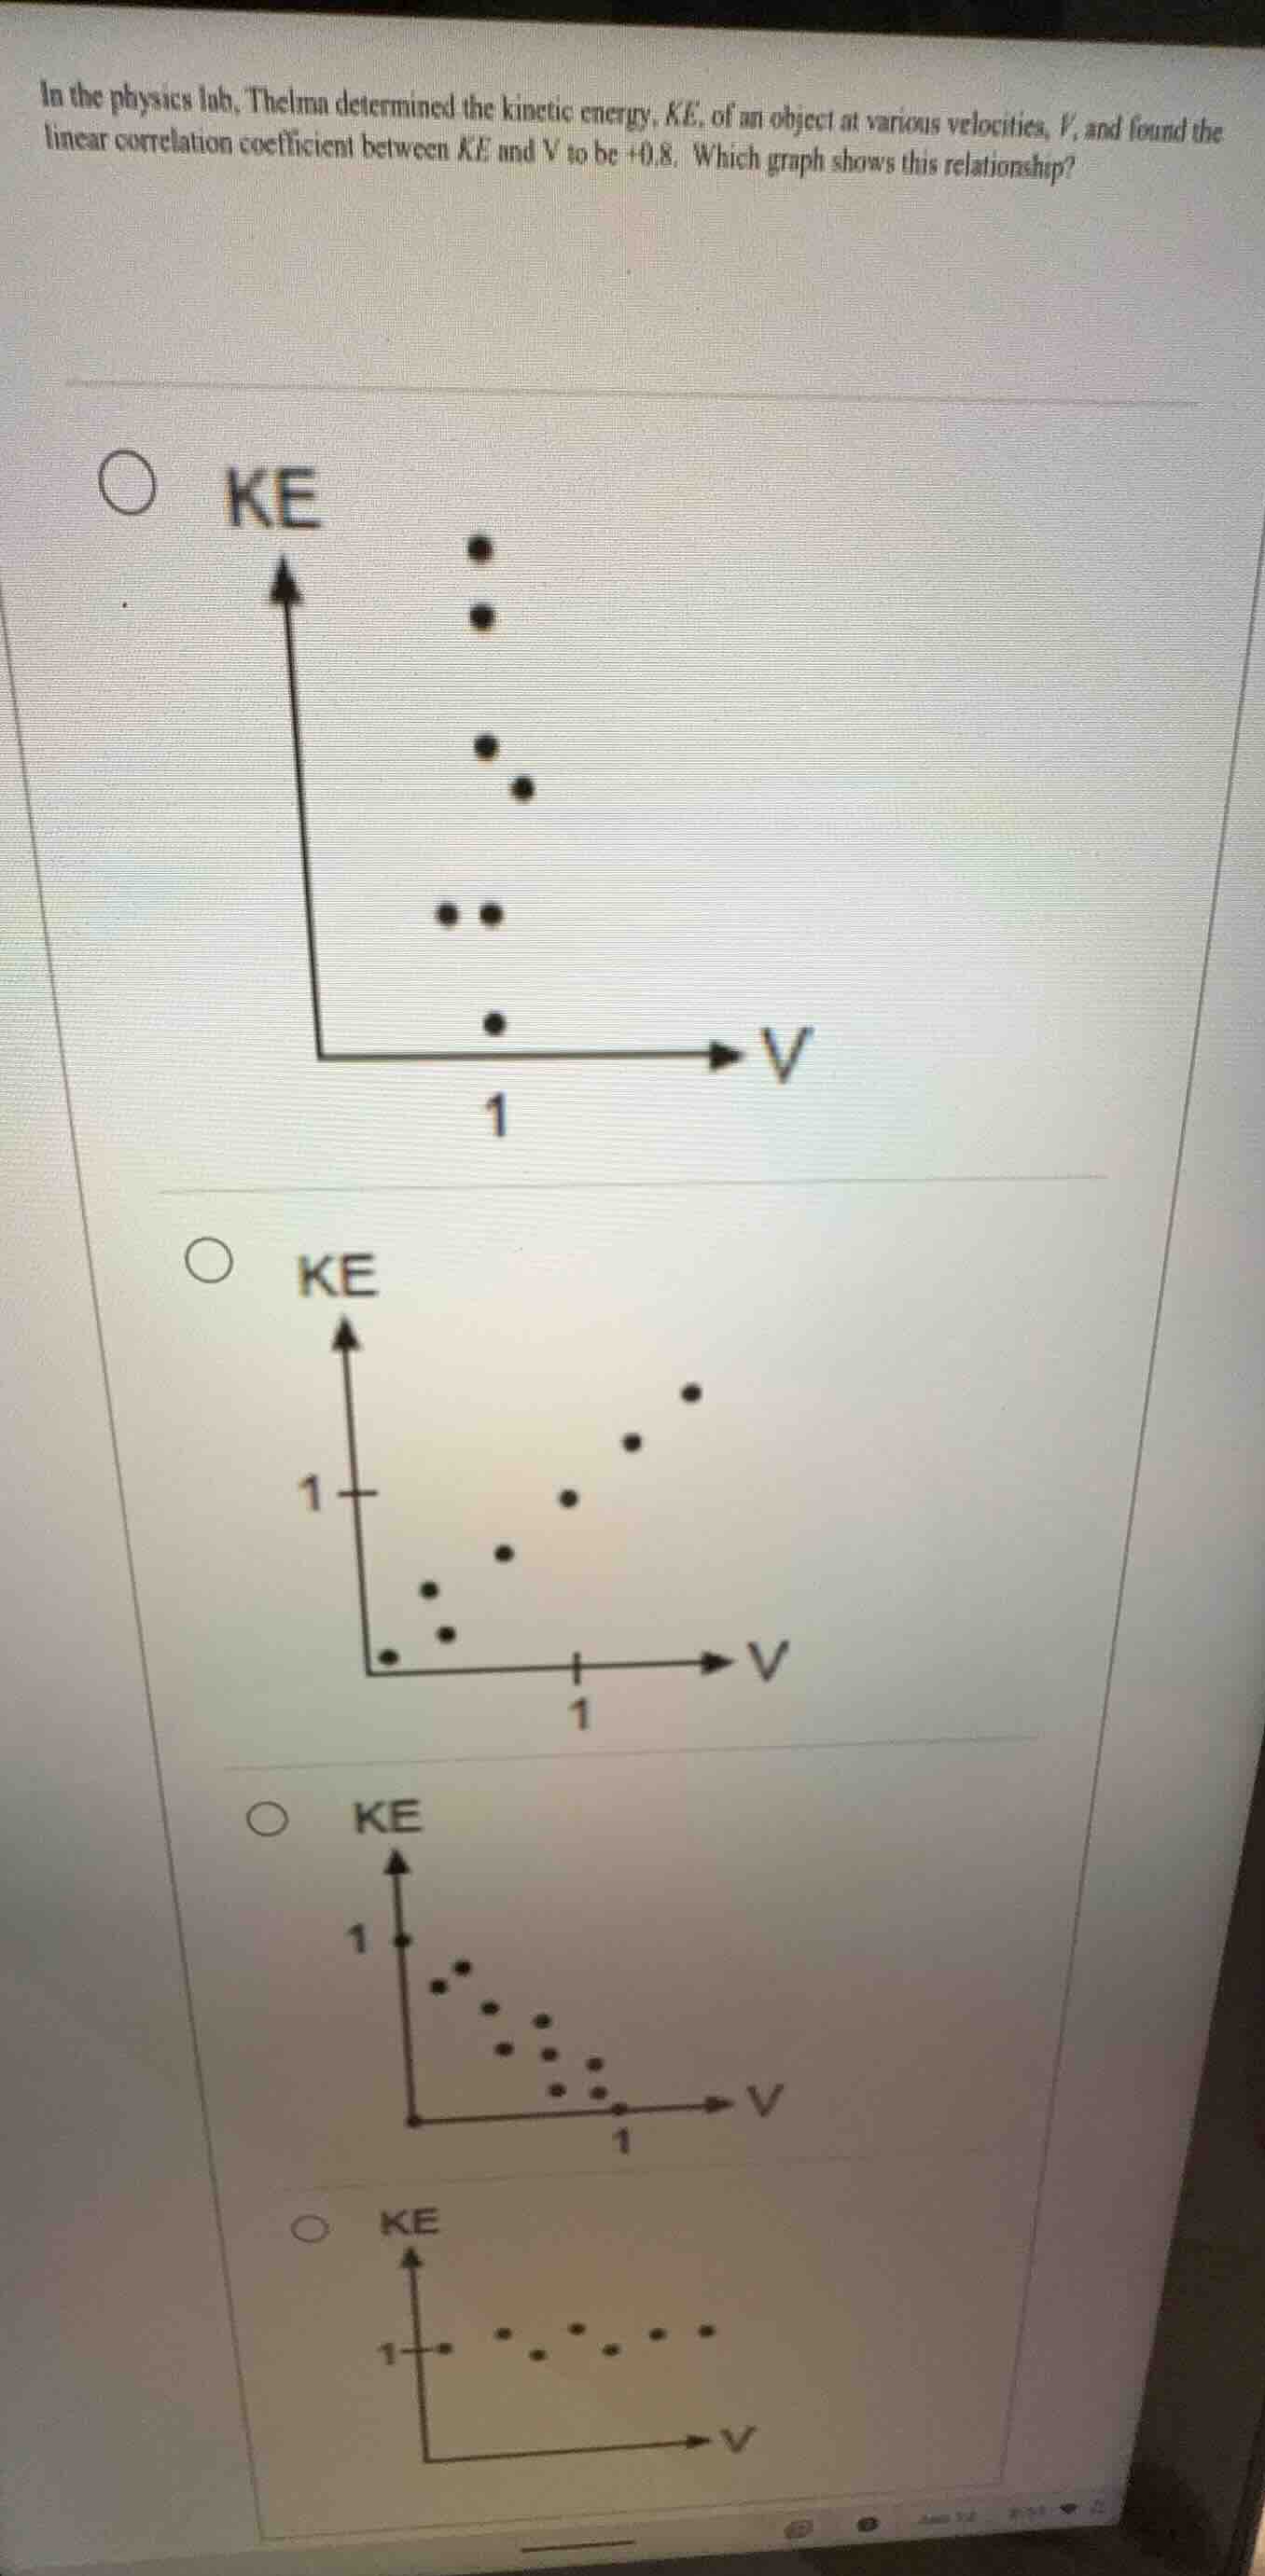
in the physics lab, thelma determined the kinetic energy, ke, of an object at various velocities, v, and found the linear correlation coefficient between ke and v to be +0.8. which graph shows this relationship? graphs are shown with ke on y - axis and v on x - axis. the first graph has scattered points, the second has a positive linear trend, the third has a negative linear trend, the fourth has points with no clear linear trend
Step1: Interpret correlation coefficient
A linear correlation coefficient of +0.8 means there is a strong positive linear relationship: as velocity $V$ increases, kinetic energy $KE$ tends to increase, with data points clustered closely around an upward-sloping line.
Step2: Analyze each graph
- Graph 1: Points slope downward (negative correlation, matches -0.8, not +0.8).
- Graph 2: Points slope upward, tightly clustered (strong positive correlation, matches +0.8).
- Graph 3: Points slope downward (negative correlation, matches -0.8, not +0.8).
- Graph 4: Points show no upward/downward trend (near-zero correlation, not +0.8).

Snap & solve any problem in the app
Get step-by-step solutions on Sovi AI
Photo-based solutions with guided steps
Explore more problems and detailed explanations
The second scatter plot (with KE on y-axis, V on x-axis, points increasing upward from left to right in a tight cluster)