QUESTION IMAGE
Question
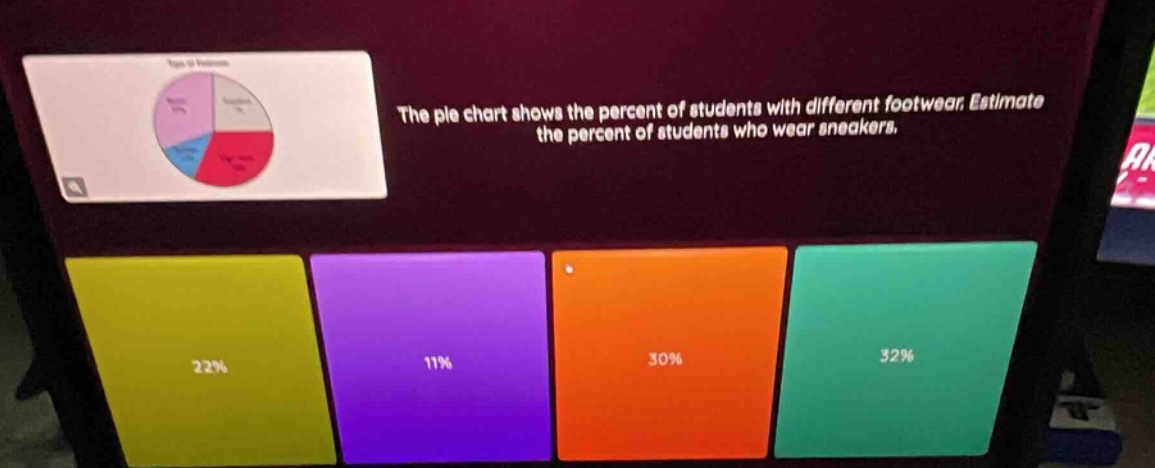
the pie chart shows the percent of students with different footwear. estimate the percent of students who wear sneakers. 22% 11% 30% 32%
Step1: Analyze pie chart segments
The pie chart has 4 segments. The red segment (sneakers) is the largest, visually larger than a quarter (25%) and close to a third (~33%).
Step2: Match to options
Compare visual estimate to given options: 22% is too small, 11% is much smaller, 30% is close but 32% is the closest to the ~33% visual estimate of the largest segment.

Snap & solve any problem in the app
Get step-by-step solutions on Sovi AI
Photo-based solutions with guided steps
Explore more problems and detailed explanations
32%