QUESTION IMAGE
Question
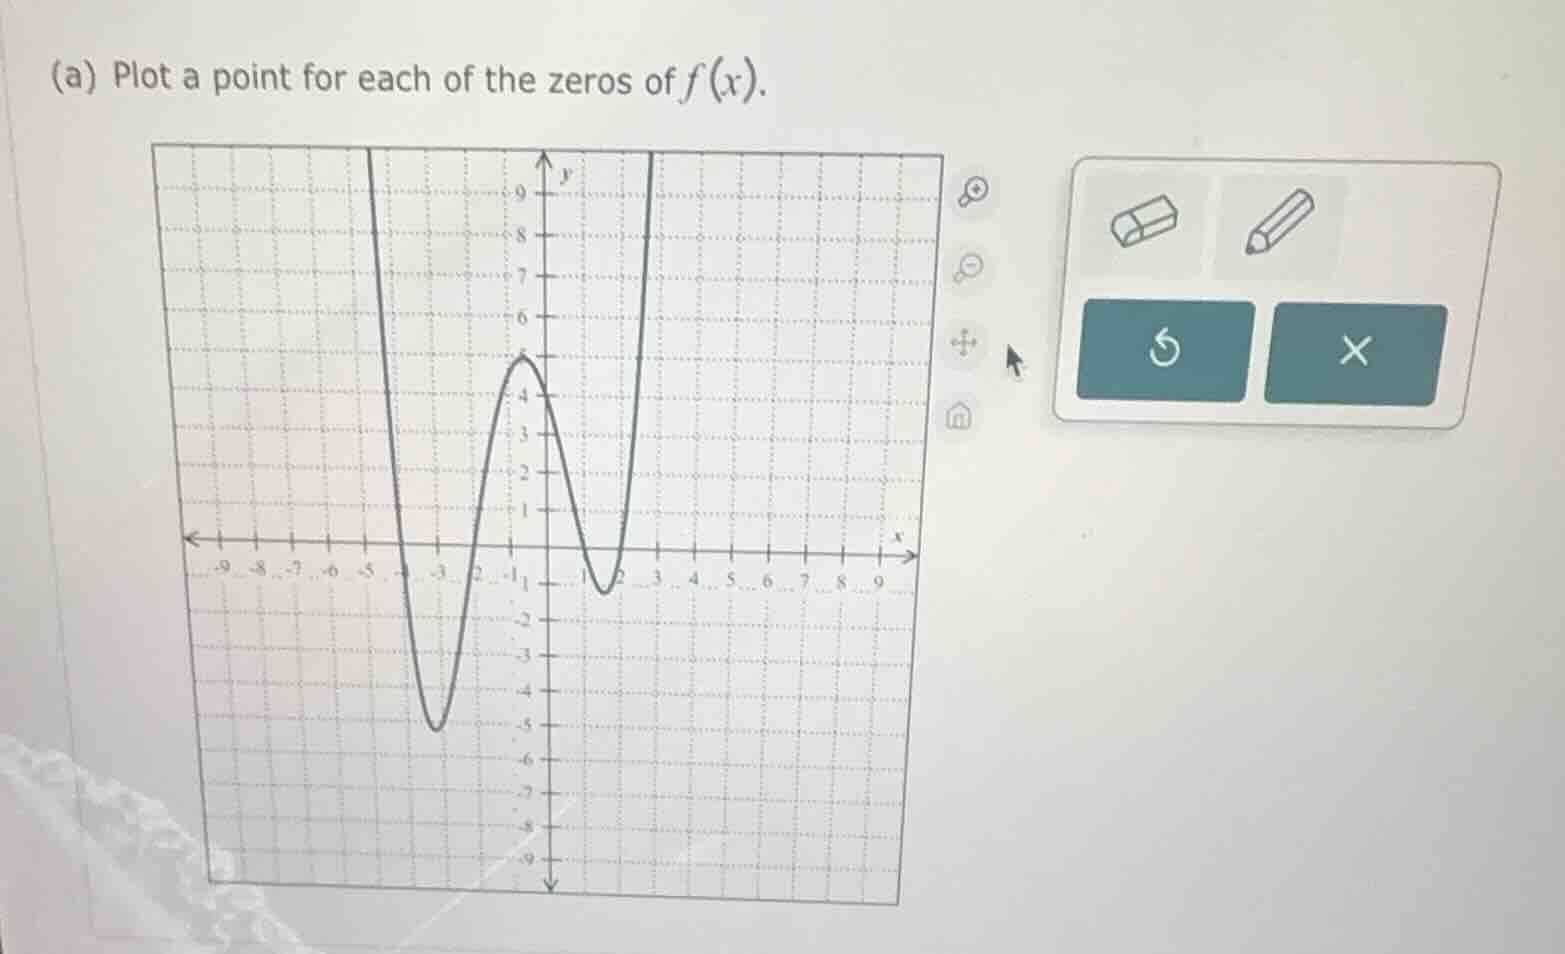
(a) plot a point for each of the zeros of $f(x)$.
Step1: Identify zeros on graph
Zeros of $f(x)$ are where the graph crosses the $x$-axis ($y=0$). From the graph, these occur at $x=-4$ and $x=2$.
Step2: Plot the zero points
The points are $(-4, 0)$ and $(2, 0)$.

Snap & solve any problem in the app
Get step-by-step solutions on Sovi AI
Photo-based solutions with guided steps
Explore more problems and detailed explanations
The zeros are plotted at the points $(-4, 0)$ and $(2, 0)$ on the coordinate grid.