QUESTION IMAGE
Question
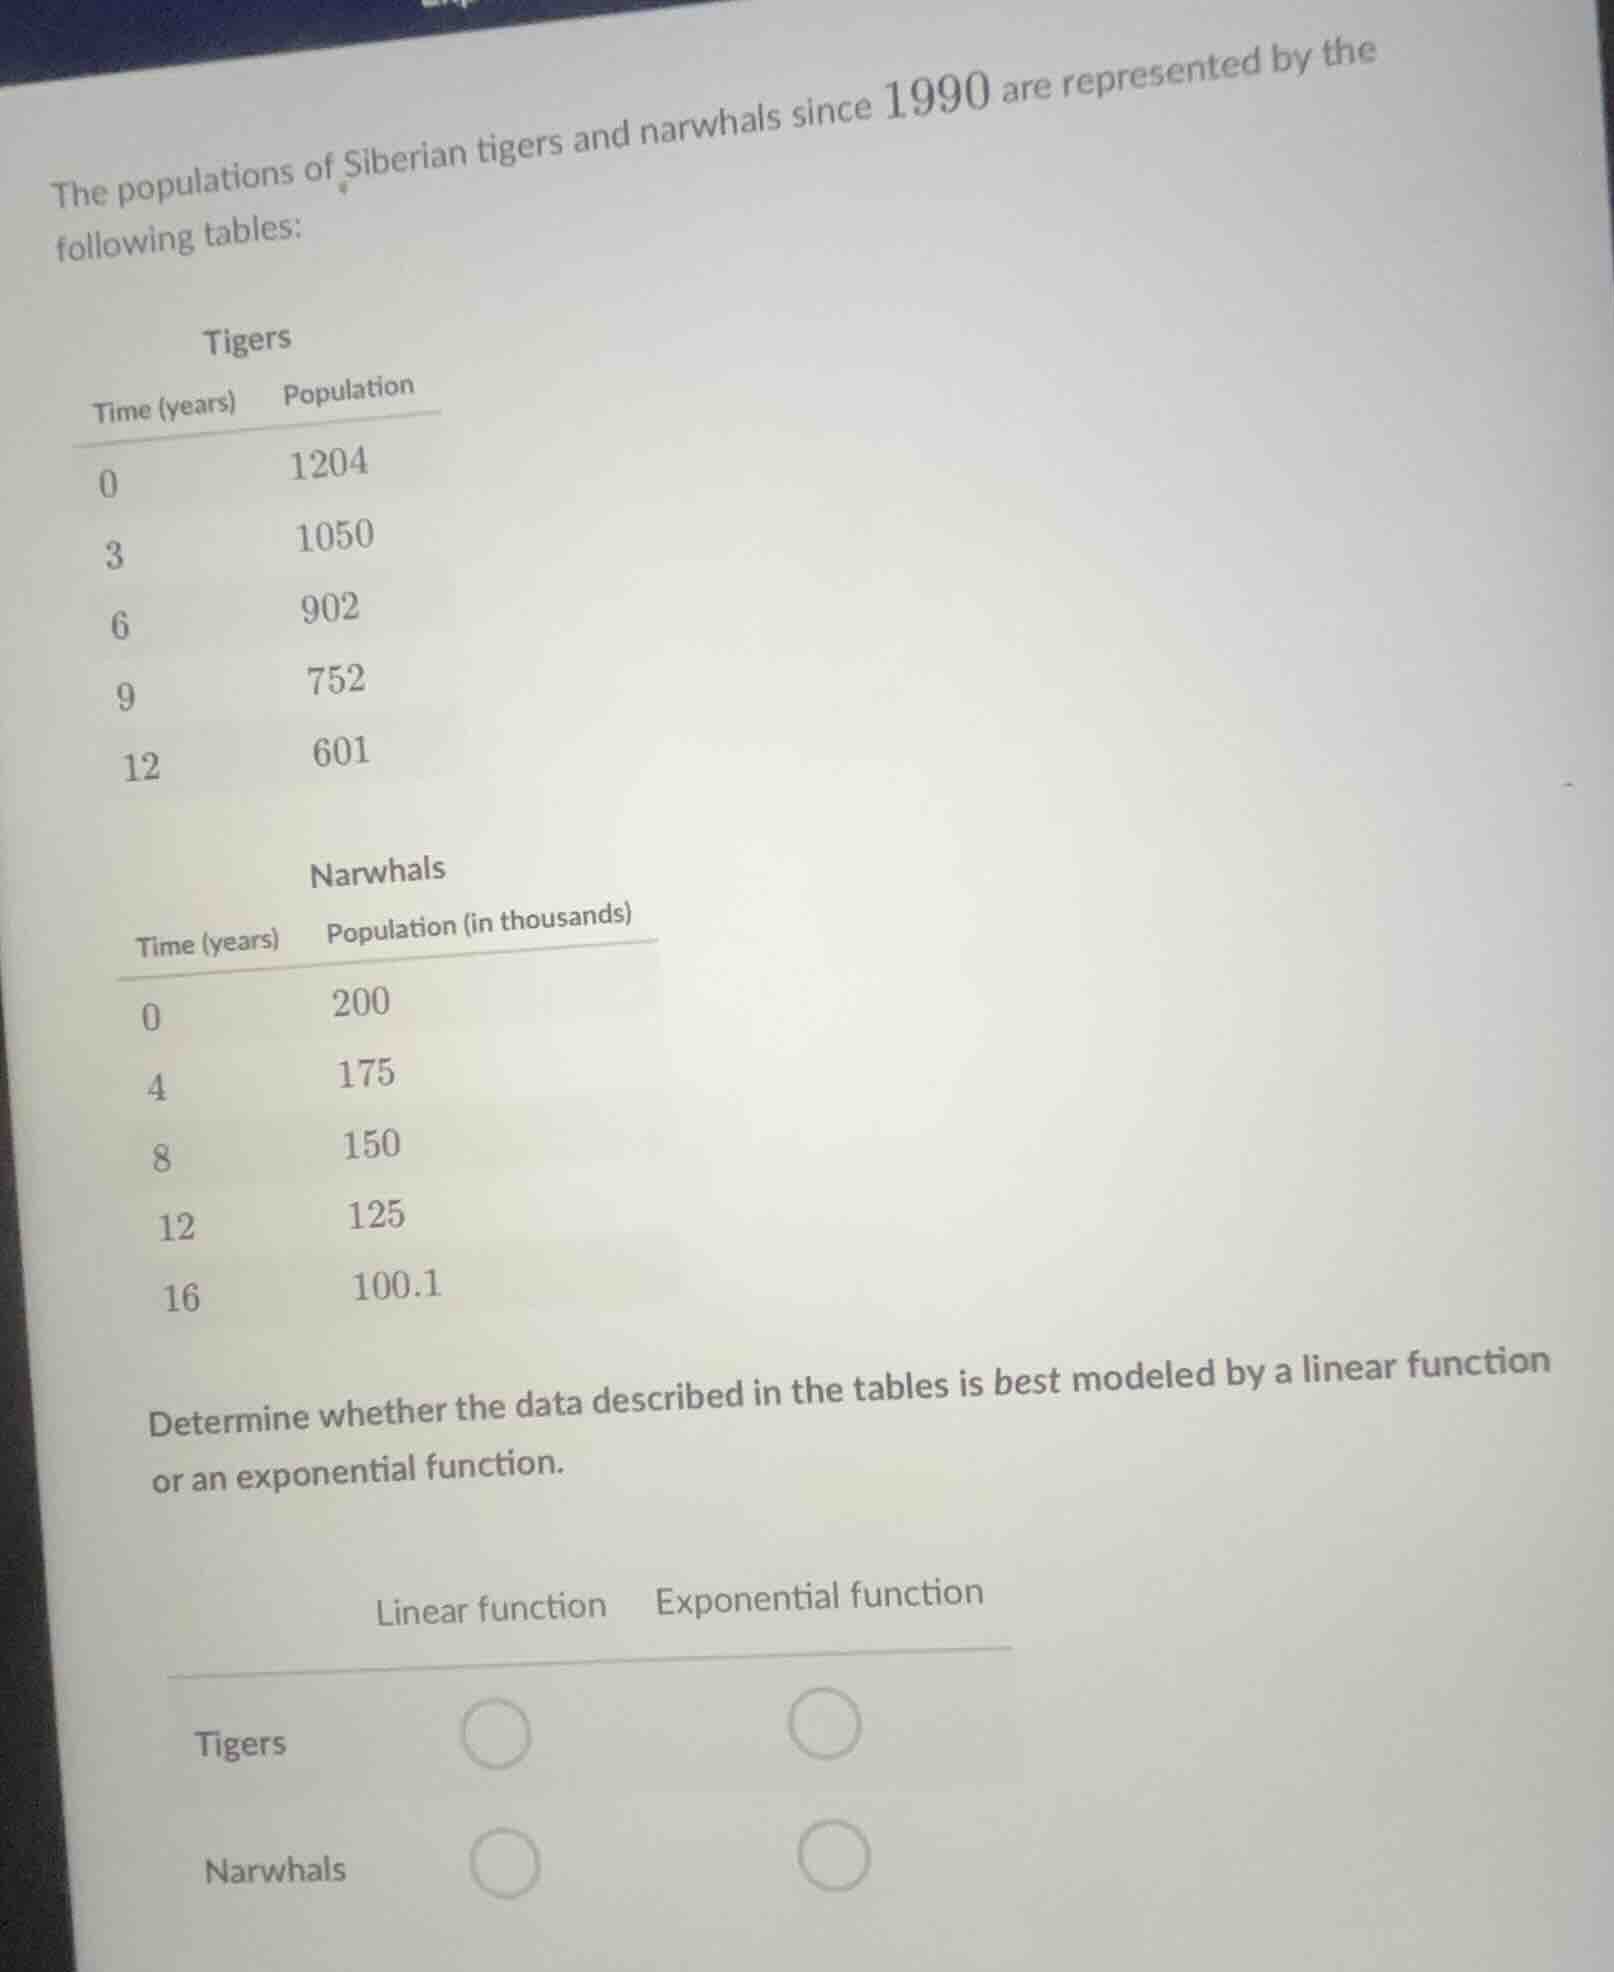
the populations of siberian tigers and narwhals since 1990 are represented by the following tables: tigers time (years) population 0 1204 3 1050 6 902 9 752 12 601 narwhals time (years) population (in thousands) 0 200 4 175 8 150 12 125 16 100.1 determine whether the data described in the tables is best modeled by a linear function or an exponential function. linear function exponential function tigers ○ ○ narwhals ○ ○
Step1: Check tiger population differences
Calculate the change in population for each 3-year interval:
$1204 - 1050 = 154$
$1050 - 902 = 148$
$902 - 752 = 150$
$752 - 601 = 151$
Step2: Check tiger population ratios
Calculate the ratio of consecutive populations:
$\frac{1050}{1204} \approx 0.872$
$\frac{902}{1050} \approx 0.859$
$\frac{752}{902} \approx 0.834$
$\frac{601}{752} \approx 0.800$
Step3: Check narwhal population differences
Calculate the change in population for each 4-year interval:
$200 - 175 = 25$
$175 - 150 = 25$
$150 - 125 = 25$
$125 - 100.1 = 24.9 \approx 25$
Step4: Check narwhal population ratios
Calculate the ratio of consecutive populations:
$\frac{175}{200} = 0.875$
$\frac{150}{175} \approx 0.857$
$\frac{125}{150} \approx 0.833$
$\frac{100.1}{125} \approx 0.801$

Snap & solve any problem in the app
Get step-by-step solutions on Sovi AI
Photo-based solutions with guided steps
Explore more problems and detailed explanations
Tigers: Exponential function
Narwhals: Linear function