QUESTION IMAGE
Question
practice & problem solving
leveled practice in 7 and 8, complete each statement.
7 use the stem - and - leaf plot
a. the data set is evenly distributed, so the appropriate measure of
variability is the
b. the data set has no outliers, so the appropriate measure of center
is the
number of fish in
a fish tank
0 9 9
1 1 2 5 5 6 6 7 7 7 8
2 0 1 1
key: 0 | 9 = 9 fish
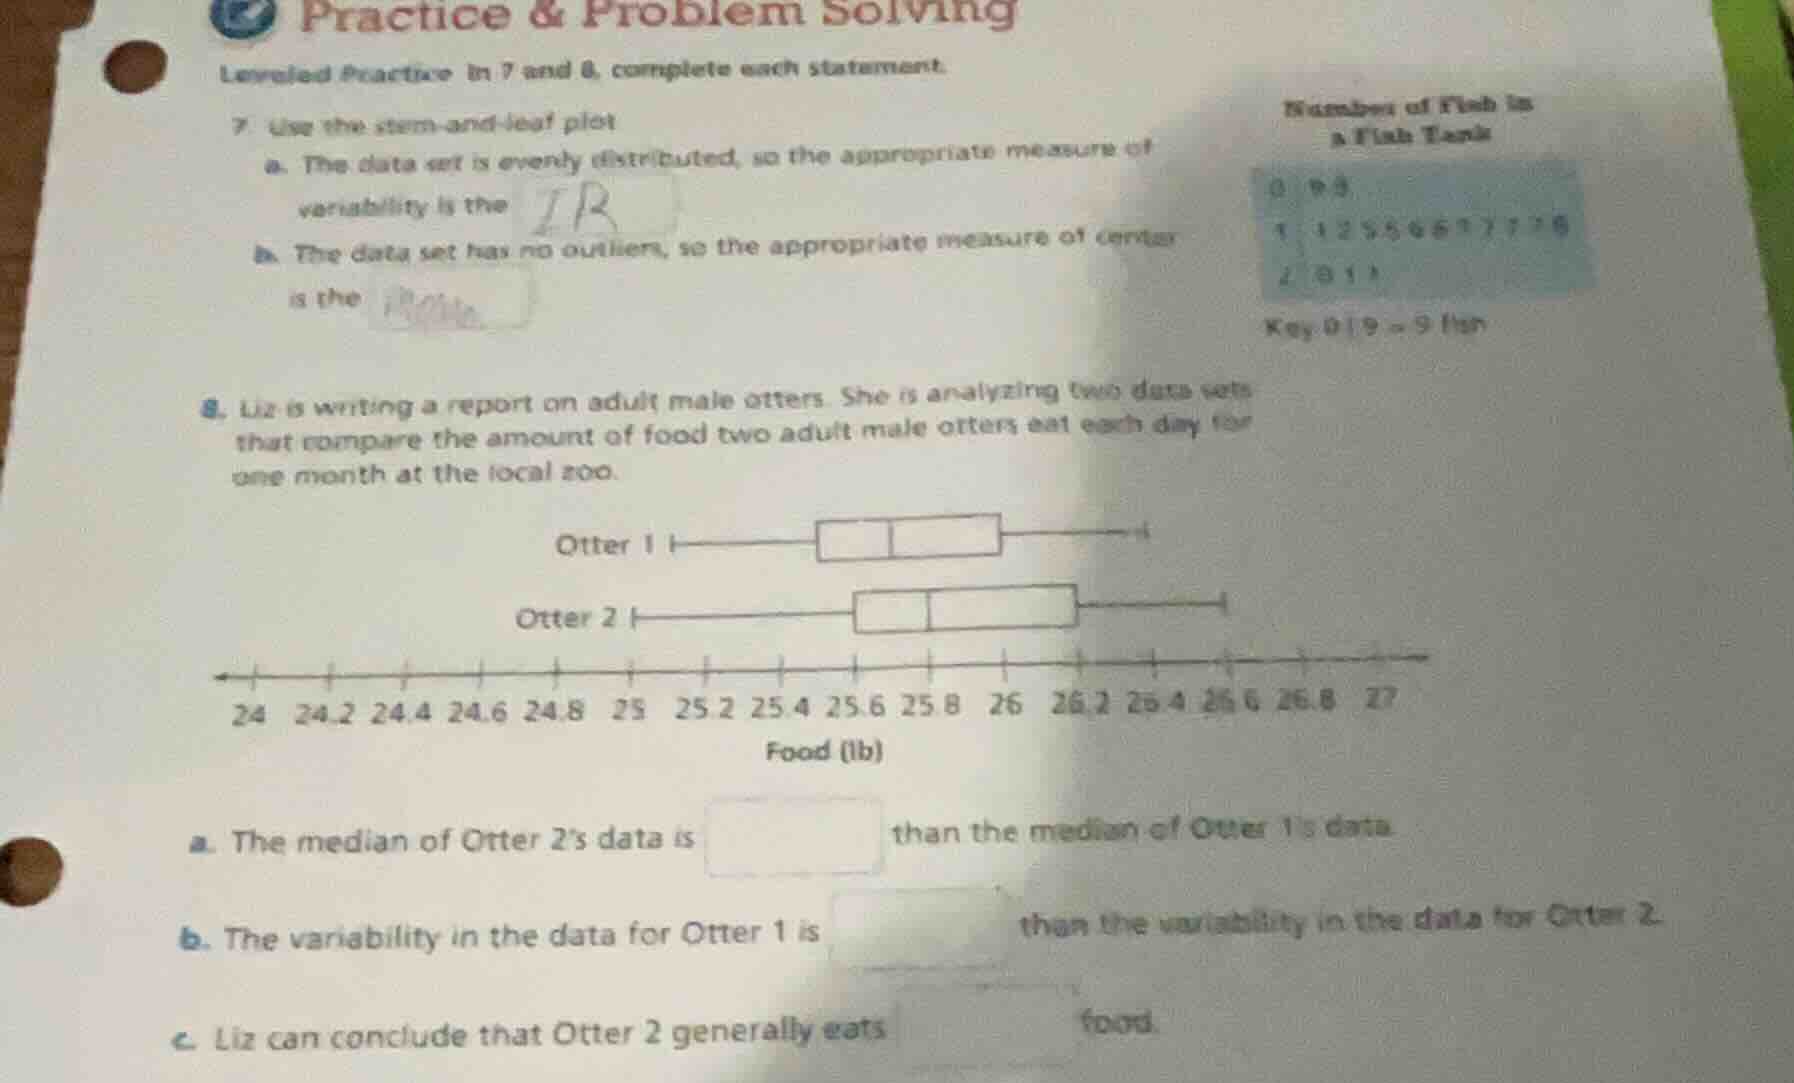
- liz is writing a report on adult male otters. she is analyzing two data sets
that compare the amount of food two adult male otters eat each day for
one month at the local zoo.
(box - and - whisker plot for otter 1 and otter 2 with x - axis labeled food (lb) from 24 to 27)
a. the median of otter 2’s data is than the median of otter 1’s data.
b. the variability in the data for otter 1 is than the variability in the data for otter 2.
c. liz can conclude that otter 2 generally eats food.
For Question 7:
Step1: Identify variability measure for even data
For evenly distributed data with no outliers, the interquartile range (IQR) or standard deviation works, but IQR is robust, and since the data is symmetric, IQR is appropriate.
Step2: Identify center measure for no outliers
For a symmetric, outlier-free data set, the mean (or median, but mean is standard for symmetric data) is the appropriate center measure. First, confirm the data from the stem-and-leaf plot: data points are 6,9,11,12,15,15,16,16,17,17,17,18,20,21,21. This is symmetric, so mean is valid.
Step1: Compare medians from boxplots
The median is the line inside the box. Otter 2's box has its median line at a higher value (~25.8) than Otter 1's (~25.6).
Step2: Compare variability (spread)
Variability is the total length of the whiskers + box. Otter 1's range is ~24 to 26.4, Otter 2's is ~24 to 27. So Otter 1 has smaller spread.
Step3: Interpret overall food consumption
Otter 2's median and upper range are higher, so it eats more overall.

Snap & solve any problem in the app
Get step-by-step solutions on Sovi AI
Photo-based solutions with guided steps
Explore more problems and detailed explanations
a. Interquartile Range (IQR)
b. Mean (or Median)
---