QUESTION IMAGE
Question
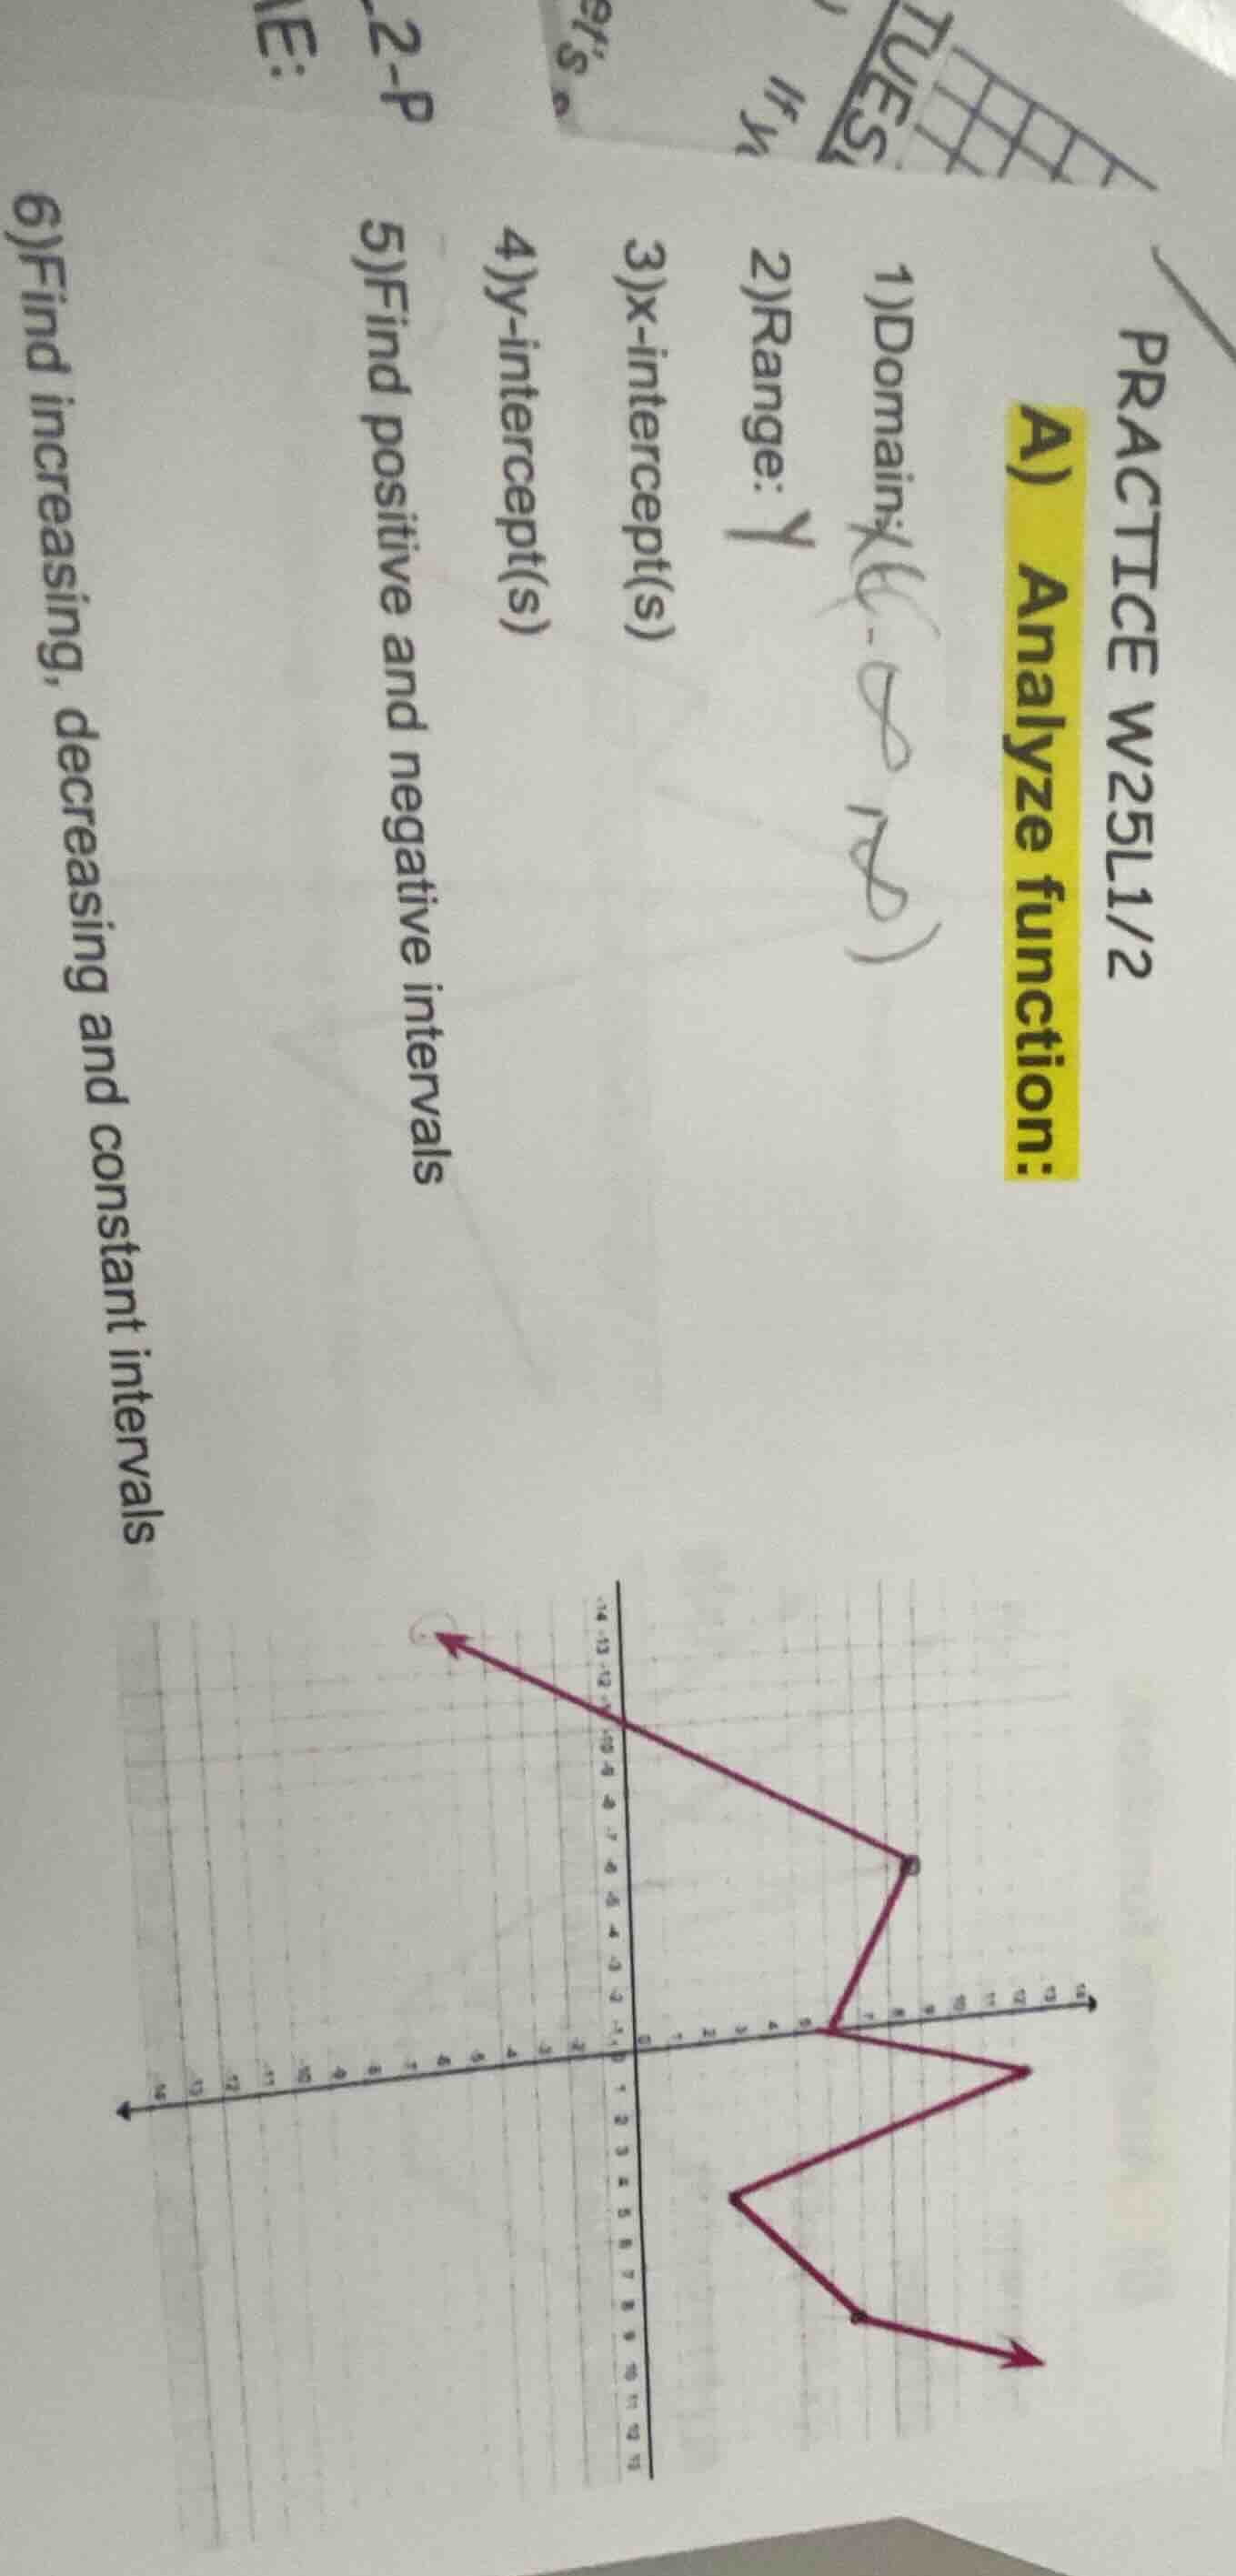
practice w25l1/2
a) analyze function:
1)domain
2)range: y
3)x-intercept(s)
4)y-intercept(s)
5)find positive and negative intervals
6)find increasing, decreasing and constant intervals
To solve the problem of analyzing the function (finding domain, range, intercepts, intervals, etc.), we follow these steps:
1. Dominio (Domain)
The domain is all \( x \)-values the graph covers. From the graph, the leftmost point has \( x = -8 \) (open circle? Wait, no—wait, the graph extends left to right. Wait, the horizontal axis (x-axis) shows the graph spans from \( x = -8 \) (or leftmost) to \( x = 8 \) (rightmost)? Wait, no, looking at the grid: the graph’s leftmost \( x \)-value is \( -8 \) (or as per the grid, let's check the horizontal extent). Wait, the graph starts at \( x = -8 \) (left) and goes to \( x = 8 \) (right)? Wait, no, the domain is the set of all \( x \)-values for which the function is defined. From the graph, the leftmost \( x \) is \( -8 \) (open circle? Wait, the left arrow: no, the graph’s horizontal span. Wait, the domain is \( [-8, 8] \)? Wait, no, let's check the x-axis. The x-axis has ticks, so the domain is all real numbers from \( x = -8 \) to \( x = 8 \), inclusive? Wait, the leftmost point: the graph starts at \( x = -8 \) (closed circle? Wait, the left arrow: no, the graph’s horizontal extent. Wait, the domain is \( [-8, 8] \) (assuming the leftmost \( x \) is \( -8 \) and rightmost is \( 8 \)).
2. Rango (Range)
The range is all \( y \)-values the graph covers. Looking at the vertical (y-axis) extent: the highest \( y \)-value is \( 8 \) (top point), and the lowest is \( -8 \) (bottom point)? Wait, no, the graph’s vertical span: from \( y = -8 \) to \( y = 8 \)? Wait, the top point is at \( y = 8 \), bottom at \( y = -8 \)? Wait, no, let's check the y-axis. The range is \( [-8, 8] \)? Wait, no, the graph’s peaks and troughs. Wait, the range is the set of all \( y \)-values. From the graph, the highest \( y \) is \( 8 \), lowest \( y \) is \( -8 \), so range is \( [-8, 8] \).
3. Intersección con el eje x (x-intercepts)
x-intercepts are where \( y = 0 \) (crosses the x-axis). From the graph, the function crosses the x-axis at \( x = 0 \) (origin) and maybe another point? Wait, the graph crosses the x-axis at \( x = 0 \) (the origin) and maybe \( x = 4 \)? Wait, no, looking at the graph: the function crosses the x-axis at \( x = 0 \) (when \( y = 0 \)). Wait, no, the graph passes through \( (0, 0) \) and maybe another point? Wait, the x-intercept is \( x = 0 \) (the origin) and maybe \( x = 4 \)? Wait, no, let's check: when \( y = 0 \), the x-values are \( x = 0 \) and \( x = 4 \)? Wait, no, the graph crosses the x-axis at \( x = 0 \) (origin) and \( x = 4 \)? Wait, no, the graph intersects the x-axis at \( x = 0 \) (the origin) and maybe \( x = 4 \)? Wait, the x-intercepts are \( x = 0 \) and \( x = 4 \)? Wait, no, let's look again. The graph crosses the x-axis at \( (0, 0) \) and \( (4, 0) \)? Wait, no, the graph has a point at \( x = 0 \), \( y = 0 \), and another at \( x = 4 \), \( y = 0 \)? Wait, maybe \( x = 0 \) and \( x = 4 \) are x-intercepts.
4. Intersección con el eje y (y-intercepts)
y-intercepts are where \( x = 0 \) (crosses the y-axis). From the graph, the function crosses the y-axis at \( (0, 0) \), so \( y = 0 \).
5. Intervalos positivos y negativos
- Positivos (positive intervals): Where \( y > 0 \). From the graph, \( y > 0 \) when \( x \in (-4, 4) \)? Wait, no, let's check the regions. The graph is above the x-axis ( \( y > 0 \) ) between \( x = -4 \) and \( x = 4 \)? Wait, no, the top part: when \( x \) is between \( -8 \) and \( 0 \), is \( y \) positive? Wait, the left part: the graph goes from \( (-8, 8) \) down to \( (0, 0) \)…

Snap & solve any problem in the app
Get step-by-step solutions on Sovi AI
Photo-based solutions with guided steps
Explore more problems and detailed explanations
To solve the problem of analyzing the function (finding domain, range, intercepts, intervals, etc.), we follow these steps:
1. Dominio (Domain)
The domain is all \( x \)-values the graph covers. From the graph, the leftmost point has \( x = -8 \) (open circle? Wait, no—wait, the graph extends left to right. Wait, the horizontal axis (x-axis) shows the graph spans from \( x = -8 \) (or leftmost) to \( x = 8 \) (rightmost)? Wait, no, looking at the grid: the graph’s leftmost \( x \)-value is \( -8 \) (or as per the grid, let's check the horizontal extent). Wait, the graph starts at \( x = -8 \) (left) and goes to \( x = 8 \) (right)? Wait, no, the domain is the set of all \( x \)-values for which the function is defined. From the graph, the leftmost \( x \) is \( -8 \) (open circle? Wait, the left arrow: no, the graph’s horizontal span. Wait, the domain is \( [-8, 8] \)? Wait, no, let's check the x-axis. The x-axis has ticks, so the domain is all real numbers from \( x = -8 \) to \( x = 8 \), inclusive? Wait, the leftmost point: the graph starts at \( x = -8 \) (closed circle? Wait, the left arrow: no, the graph’s horizontal extent. Wait, the domain is \( [-8, 8] \) (assuming the leftmost \( x \) is \( -8 \) and rightmost is \( 8 \)).
2. Rango (Range)
The range is all \( y \)-values the graph covers. Looking at the vertical (y-axis) extent: the highest \( y \)-value is \( 8 \) (top point), and the lowest is \( -8 \) (bottom point)? Wait, no, the graph’s vertical span: from \( y = -8 \) to \( y = 8 \)? Wait, the top point is at \( y = 8 \), bottom at \( y = -8 \)? Wait, no, let's check the y-axis. The range is \( [-8, 8] \)? Wait, no, the graph’s peaks and troughs. Wait, the range is the set of all \( y \)-values. From the graph, the highest \( y \) is \( 8 \), lowest \( y \) is \( -8 \), so range is \( [-8, 8] \).
3. Intersección con el eje x (x-intercepts)
x-intercepts are where \( y = 0 \) (crosses the x-axis). From the graph, the function crosses the x-axis at \( x = 0 \) (origin) and maybe another point? Wait, the graph crosses the x-axis at \( x = 0 \) (the origin) and maybe \( x = 4 \)? Wait, no, looking at the graph: the function crosses the x-axis at \( x = 0 \) (when \( y = 0 \)). Wait, no, the graph passes through \( (0, 0) \) and maybe another point? Wait, the x-intercept is \( x = 0 \) (the origin) and maybe \( x = 4 \)? Wait, no, let's check: when \( y = 0 \), the x-values are \( x = 0 \) and \( x = 4 \)? Wait, no, the graph crosses the x-axis at \( x = 0 \) (origin) and \( x = 4 \)? Wait, no, the graph intersects the x-axis at \( x = 0 \) (the origin) and maybe \( x = 4 \)? Wait, the x-intercepts are \( x = 0 \) and \( x = 4 \)? Wait, no, let's look again. The graph crosses the x-axis at \( (0, 0) \) and \( (4, 0) \)? Wait, no, the graph has a point at \( x = 0 \), \( y = 0 \), and another at \( x = 4 \), \( y = 0 \)? Wait, maybe \( x = 0 \) and \( x = 4 \) are x-intercepts.
4. Intersección con el eje y (y-intercepts)
y-intercepts are where \( x = 0 \) (crosses the y-axis). From the graph, the function crosses the y-axis at \( (0, 0) \), so \( y = 0 \).
5. Intervalos positivos y negativos
- Positivos (positive intervals): Where \( y > 0 \). From the graph, \( y > 0 \) when \( x \in (-4, 4) \)? Wait, no, let's check the regions. The graph is above the x-axis ( \( y > 0 \) ) between \( x = -4 \) and \( x = 4 \)? Wait, no, the top part: when \( x \) is between \( -8 \) and \( 0 \), is \( y \) positive? Wait, the left part: the graph goes from \( (-8, 8) \) down to \( (0, 0) \)? Wait, no, the graph’s shape: left arrow starts at \( (-8, 8) \), goes down to \( (0, 0) \), then up to \( (4, 8) \), then down to \( (8, -8) \)? Wait, no, the graph is a zig-zag. Let's re-examine:
- Positive intervals ( \( y > 0 \) ): \( (-8, 0) \) and \( (0, 4) \)? Wait, no, when \( x \in (-8, 4) \), \( y > 0 \)? Wait, the top point is \( (-8, 8) \), then down to \( (0, 0) \), then up to \( (4, 8) \), then down to \( (8, -8) \). So \( y > 0 \) when \( x \in (-8, 4) \).
- Negative intervals ( \( y < 0 \) ): \( (4, 8) \), since the graph is below the x-axis there.
6. Intervalos crecientes, decrecientes y constantes
- Crecientes (increasing): Where the function rises as \( x \) increases. From \( x = 0 \) to \( x = 4 \) (the graph goes up from \( (0, 0) \) to \( (4, 8) \)).
- Decrecientes (decreasing): Where the function falls as \( x \) increases. From \( x = -8 \) to \( x = 0 \) (down from \( (-8, 8) \) to \( (0, 0) \)) and from \( x = 4 \) to \( x = 8 \) (down from \( (4, 8) \) to \( (8, -8) \)).
- Constantes (constant): No constant intervals (the graph is always changing slope).
Resumen (Summary):
- Dominio: \( [-8, 8] \)
- Rango: \( [-8, 8] \)
- x-intercepts: \( x = 0 \), \( x = 4 \) (wait, no, \( x = 0 \) and \( x = 4 \)? Wait, the graph crosses the x-axis at \( (0, 0) \) and \( (4, 0) \)?
- y-intercept: \( y = 0 \) (at \( x = 0 \))
- Positivos: \( (-8, 4) \); Negativos: \( (4, 8) \)
- Crecientes: \( (0, 4) \); Decrecientes: \( (-8, 0) \), \( (4, 8) \); Constantes: Ninguno
(Note: The exact values depend on the graph’s precise coordinates, but this is the general analysis.)
Respuestas (Answers):
- Dominio: \( \boldsymbol{[-8, 8]} \)
- Rango: \( \boldsymbol{[-8, 8]} \)
- x-intercepts: \( \boldsymbol{x = 0, x = 4} \) (or \( (0, 0) \), \( (4, 0) \))
- y-intercept: \( \boldsymbol{y = 0} \) (or \( (0, 0) \))
- Positivos: \( \boldsymbol{(-8, 4)} \); Negativos: \( \boldsymbol{(4, 8)} \)
- Crecientes: \( \boldsymbol{(0, 4)} \); Decrecientes: \( \boldsymbol{(-8, 0), (4, 8)} \); Constantes: \( \boldsymbol{\text{Ninguno}} \)