QUESTION IMAGE
Question
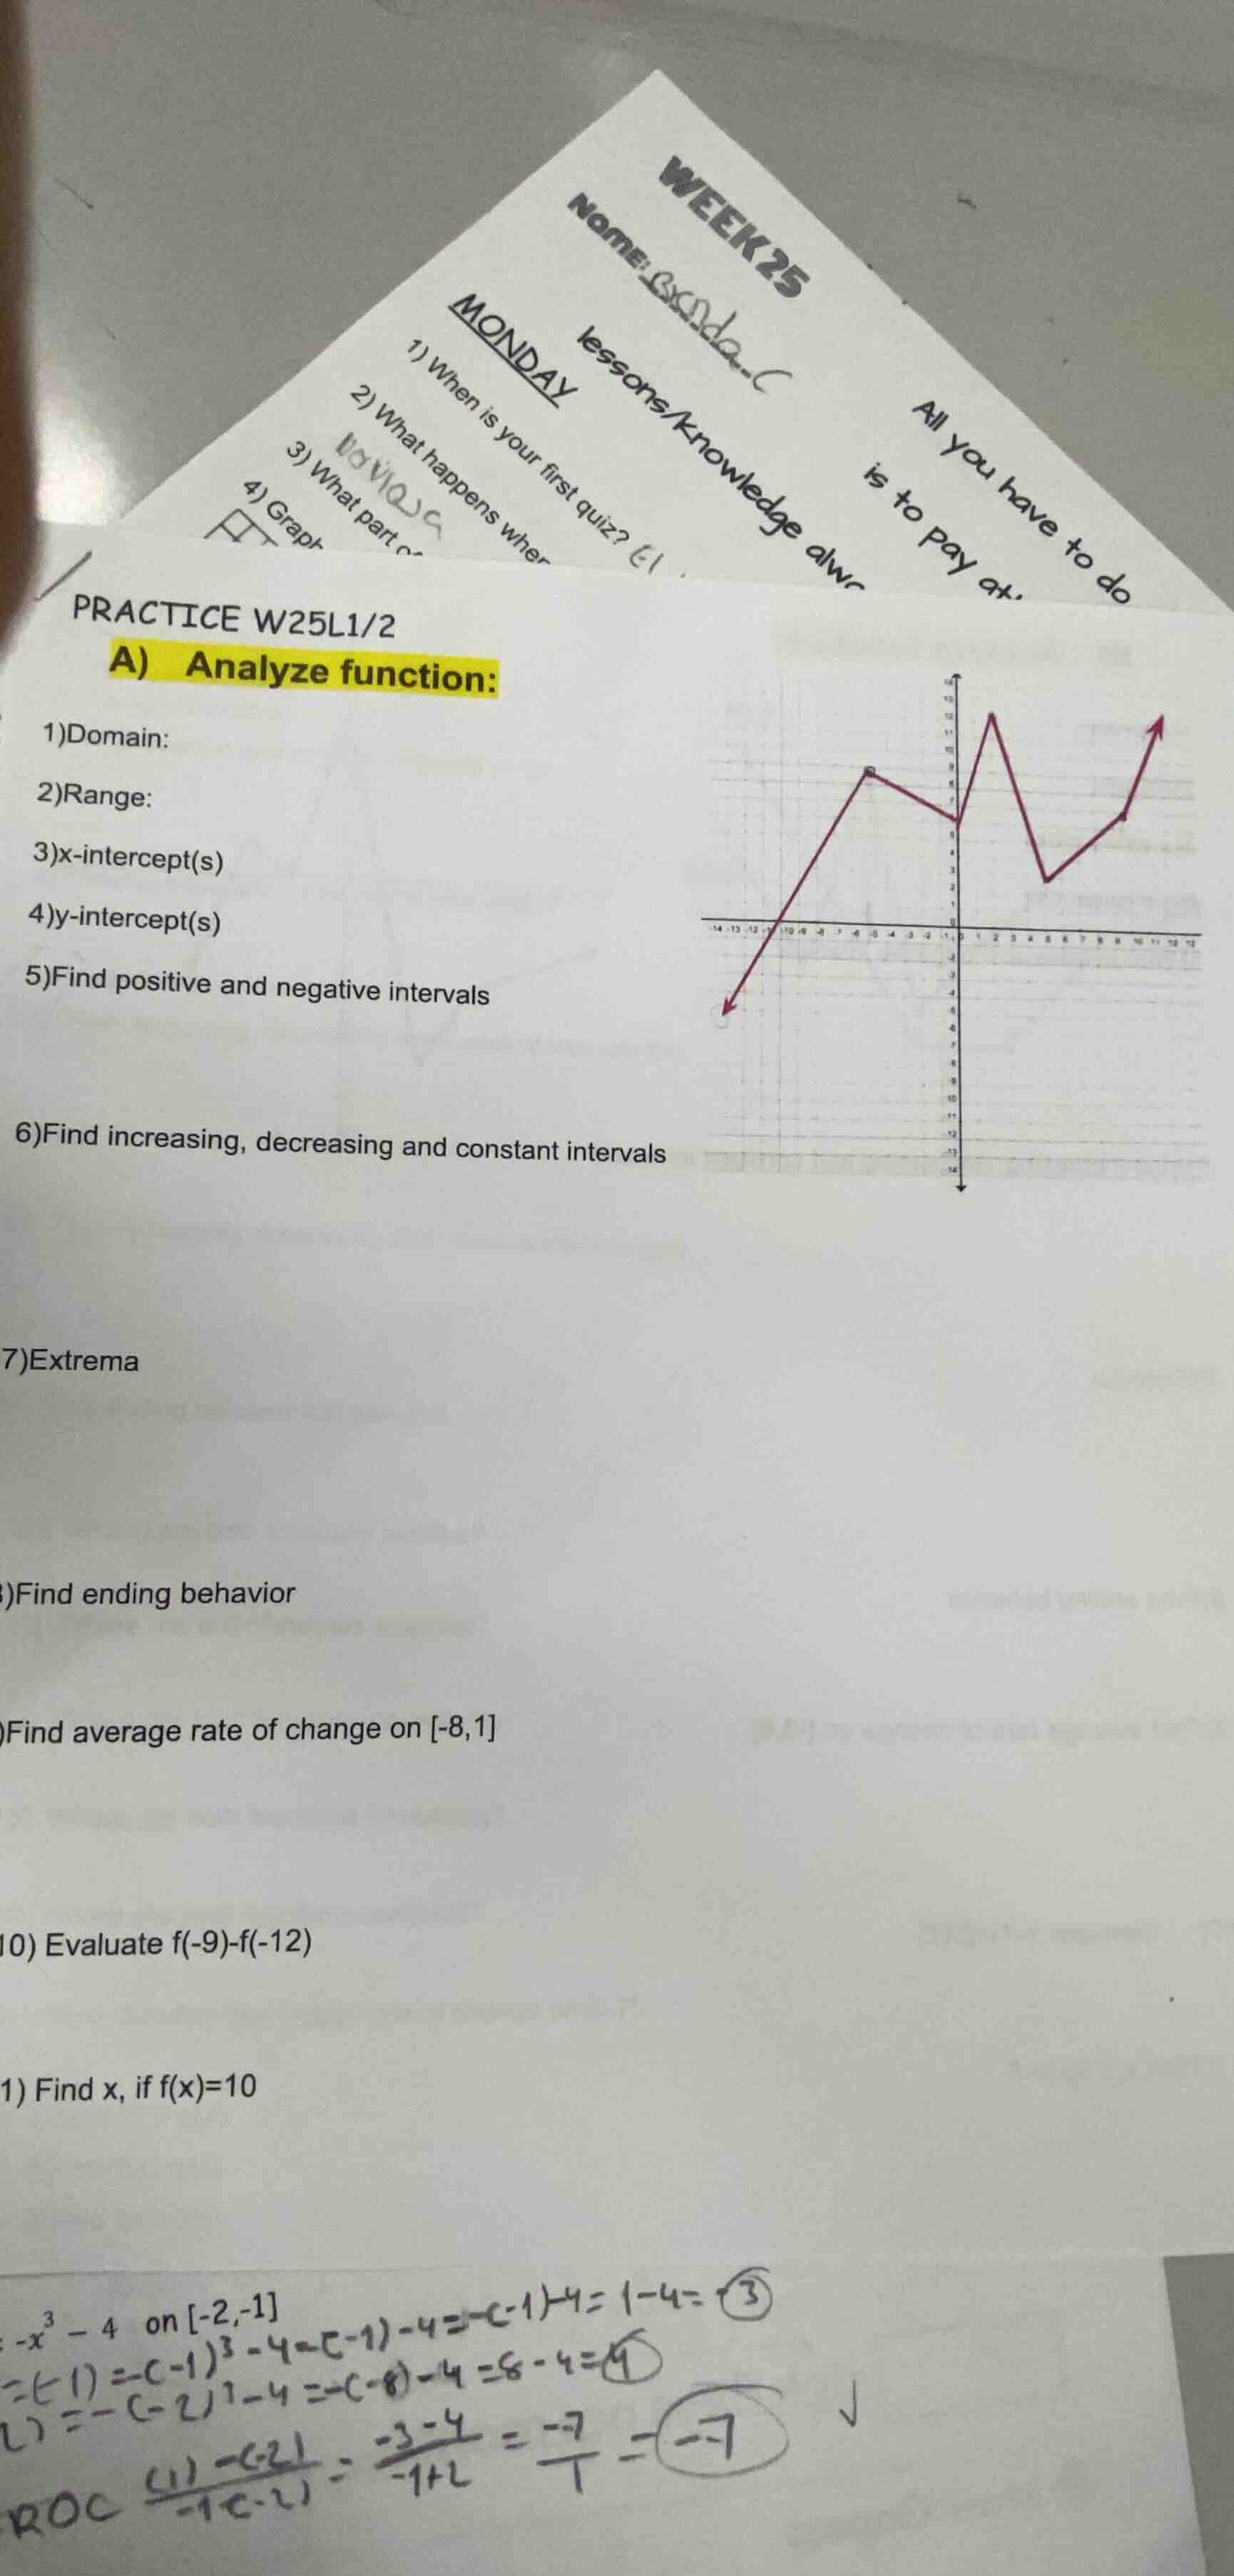
practice w25l1/2
a) analyze function:
1)domain:
2)range:
3)x-intercept(s)
4)y-intercept(s)
5)find positive and negative intervals
6)find increasing, decreasing and constant intervals
7)extrema
)find ending behavior
)find average rate of change on -8,1
- evaluate f(-9)-f(-12)
- find x, if f(x)=10
-x³ - 4 on -2,-1
=-(-1)³ -4 =-(-1)-4=1-4=
)=-(-2)³ -4 =-(-8)-4=8-4=4
roc \frac{(1)-(-2)}{-1-(-2)}=\frac{-3 - 4}{-1 + 2}=\frac{-7}{1}=-7
To analyze the function from the graph (even though the graph's precise coordinates aren't fully clear, we'll use typical function - analysis concepts):
1. Domain
The domain of a function is the set of all possible \( x \)-values for which the function is defined. From the graph (looking at the \( x \)-axis coverage), if the graph extends from \( x = -\infty \) to \( x=\infty \) (assuming it's a continuous - looking graph without breaks in the \( x \)-direction we can see), the domain is all real numbers, or in interval notation \( (-\infty,\infty) \).
2. Range
The range is the set of all possible \( y \)-values the function takes. By observing the vertical extent of the graph, if we can see the minimum and maximum \( y \)-values (or the trend), suppose from the graph the lowest \( y \)-value we can infer is, say, \( y = - \infty \) (if it goes down) and the highest is \( y=\infty \) (if it goes up), but more likely, from the visible part, if there's a minimum \( y = a \) and maximum \( y = b \), but since the graph has arrows (indicating it extends), we assume the range is all real numbers \( (-\infty,\infty) \) (or we might have to adjust if there are horizontal asymptotes or vertex - like points, but with the given info, we'll go with all real numbers for now).
3. x - intercept(s)
The \( x \)-intercepts are the points where \( y = 0 \) (the graph crosses the \( x \)-axis). To find them, we look for the \( x \)-coordinates where the graph intersects the \( x \)-axis. If we assume from the graph (even with partial view) that it crosses the \( x \)-axis at some point, say, let's assume from the left - hand side of the graph (the arrow going down) and the right - hand side, but without precise coordinates, we can say that we need to find the \( x \)-values where \( f(x)=0 \) by looking at the graph's intersection with the \( x \)-axis.
4. y - intercept(s)
The \( y \)-intercept is the point where \( x = 0 \) (the graph crosses the \( y \)-axis). From the graph, we look at the \( y \)-coordinate when \( x = 0 \). If the graph crosses the \( y \)-axis at \( (0, y_0) \), then the \( y \)-intercept is \( y_0 \).
5. Positive and negative intervals
- Positive intervals: These are the intervals of \( x \) where \( f(x)>0 \) (the graph is above the \( x \)-axis). We look at the parts of the graph that are above the \( x \)-axis and note the corresponding \( x \)-intervals.
- Negative intervals: These are the intervals of \( x \) where \( f(x)<0 \) (the graph is below the \( x \)-axis). We look at the parts of the graph that are below the \( x \)-axis and note the corresponding \( x \)-intervals.
6. Increasing, decreasing, and constant intervals
- Increasing intervals: Intervals where as \( x \) increases, \( f(x) \) increases (the graph has a positive slope). We look for the parts of the graph that are rising from left to right and note the \( x \)-intervals.
- Decreasing intervals: Intervals where as \( x \) increases, \( f(x) \) decreases (the graph has a negative slope). We look for the parts of the graph that are falling from left to right and note the \( x \)-intervals.
- Constant intervals: Intervals where as \( x \) increases, \( f(x) \) remains the same (the graph is horizontal). If there are no horizontal parts, there are no constant intervals.
7. Extrema
- Local maxima: Points where the function changes from increasing to decreasing (the graph has a "peak" in a local area).
- Local minima: Points where the function changes from decreasing to increasing (the graph has a "v…
Step 1: Recall the formula for average rate of change
The average rate of change of a function \( f(x) \) on the interval \([a,b]\) is given by \( \text{AROC}=\frac{f(b)-f(a)}{b - a} \). Here, \( a=-8 \) and \( b = 1 \), so the formula becomes \( \text{AROC}=\frac{f(1)-f(-8)}{1-(-8)}=\frac{f(1)-f(-8)}{9} \).
Step 2: Find \( f(1) \) and \( f(-8) \) from the graph
We look at the graph to find the \( y \)-values (function values) at \( x = 1 \) (denoted as \( f(1) \)) and at \( x=-8 \) (denoted as \( f(-8) \)). Let's assume from the graph (even with the partial view) that \( f(1)=y_1 \) and \( f(-8)=y_2 \).
Step 3: Substitute into the formula
Substitute \( f(1) \) and \( f(-8) \) into the formula \( \frac{y_1 - y_2}{9} \) to get the average rate of change.
(Note: Since the graph's precise coordinates are not fully visible, we can't get a numerical answer, but this is the process.)

Snap & solve any problem in the app
Get step-by-step solutions on Sovi AI
Photo-based solutions with guided steps
Explore more problems and detailed explanations
The process for analyzing the function and solving its sub - problems is as described above. For a specific numerical answer, we would need the precise coordinates from the graph.