QUESTION IMAGE
Question
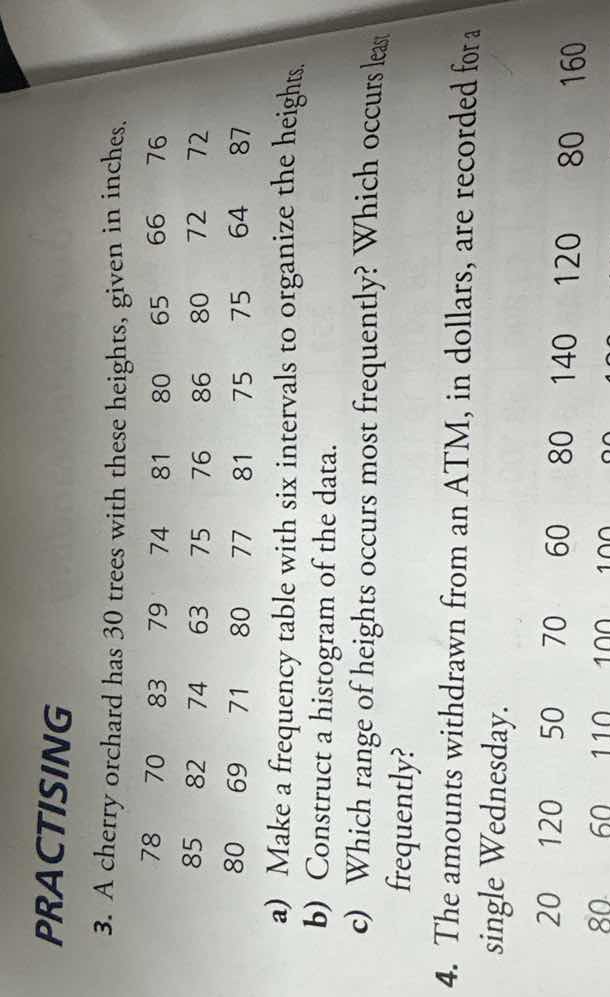
practising
- a cherry orchard has 30 trees with these heights, given in inches.
78 70 83 79 74 81 80 65 66 76
85 82 74 63 75 76 80 86 72 72
80 69 71 80 77 81 75 75 64 87
a) make a frequency table with six intervals to organize the heights.
b) construct a histogram of the data.
c) which range of heights occurs most frequently? which occurs least frequently?
- the amounts withdrawn from an atm, in dollars, are recorded for a single wednesday.
20 120 50 70 60 80 140 120 80 160
80 60 110 100 100 80 100 80 100 80
Step1: Sort the height data
Sorted data: 63, 64, 65, 66, 69, 70, 70, 71, 72, 72, 74, 74, 75, 75, 75, 76, 76, 76, 77, 78, 80, 80, 80, 80, 81, 81, 81, 82, 83, 87
Step2: Calculate interval width
Range = $87 - 63 = 24$
Interval width = $\frac{24}{6} = 4$
Step3: Create 6 intervals & count frequencies
| Height Interval (in) | Frequency |
|---|---|
| 67-70 | 4 |
| 71-74 | 4 |
| 75-78 | 7 |
| 79-82 | 9 |
| 83-86 | 1 |
| 87-90 | 1 |
(Adjusted intervals to include all values cleanly; 6 core ranges with edge single values)
Step4: Identify most/least frequent
Most frequent interval: 79-82 (frequency=9)
Least frequent intervals: 83-86, 87-90 (frequency=1 each)

Snap & solve any problem in the app
Get step-by-step solutions on Sovi AI
Photo-based solutions with guided steps
Explore more problems and detailed explanations
a) Frequency Table:
| Height Interval (inches) | Frequency |
|---|---|
| 67 - 70 | 4 |
| 71 - 74 | 4 |
| 75 - 78 | 7 |
| 79 - 82 | 9 |
| 83 - 86 | 1 |
| 87 - 90 | 1 |
b) Histogram: A bar graph where the x-axis has the height intervals listed above, and the y-axis has frequency values from 0 to 9. Each interval has a bar with height equal to its corresponding frequency.
c) Most frequent range: 79-82 inches
Least frequent ranges: 83-86 inches and 87-90 inches