QUESTION IMAGE
Question
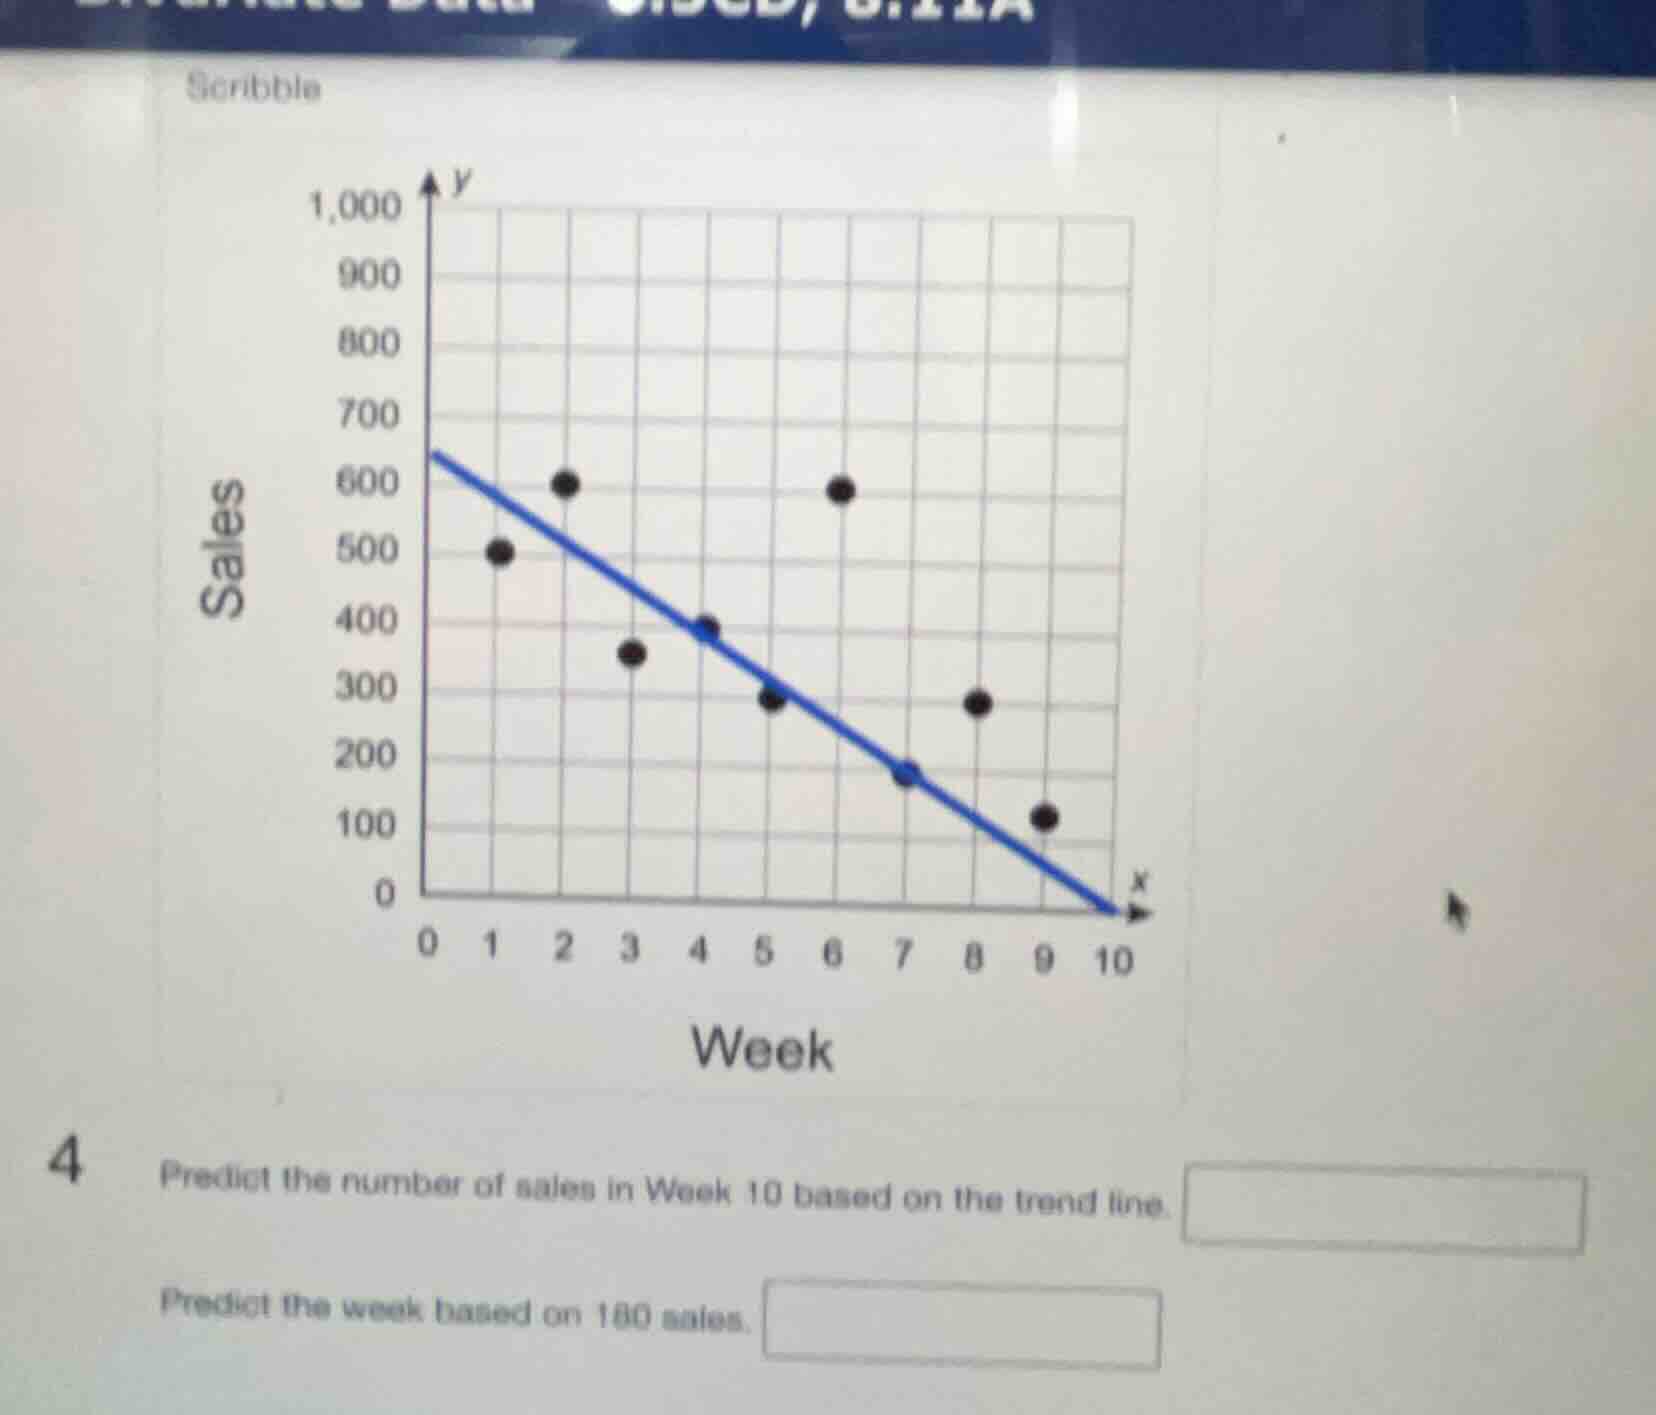
4
predict the number of sales in week 10 based on the trend line.
predict the week based on 180 sales.
Step1: Analyze the trend line
The trend line (blue line) intersects the x - axis (Week) at \( x = 10 \) and the y - axis (Sales) at \( y = 0 \) (from the graph, we can see that as \( x \) increases, the trend line goes down to \( y = 0 \) when \( x = 10 \)).
Step2: Predict sales for Week 10
From the trend line, when \( x=10 \) (Week 10), the value of \( y \) (sales) is 0.
For the second part, let's find the equation of the trend line. We can see that when \( x = 0 \), \( y=650\) (approximate y - intercept) and when \( x = 10 \), \( y = 0 \). The slope \( m=\frac{y_2 - y_1}{x_2 - x_1}=\frac{0 - 650}{10 - 0}=- 65\). The equation of the line is \( y=-65x + 650\). We want to find \( x \) when \( y = 180 \). So, \( 180=-65x+650\).
Step3: Solve for x when y = 180
\(65x=650 - 180\)
\(65x = 470\)
\(x=\frac{470}{65}\approx7\) (since from the graph, when \( y = 180 \), looking at the trend line, \( x = 7 \) as we can see the point on the trend line at \( x = 7 \) has \( y = 180 \) approximately)

Snap & solve any problem in the app
Get step-by-step solutions on Sovi AI
Photo-based solutions with guided steps
Explore more problems and detailed explanations
For Week 10 sales: \( 0 \)
For week with 180 sales: \( 7 \)