QUESTION IMAGE
Question
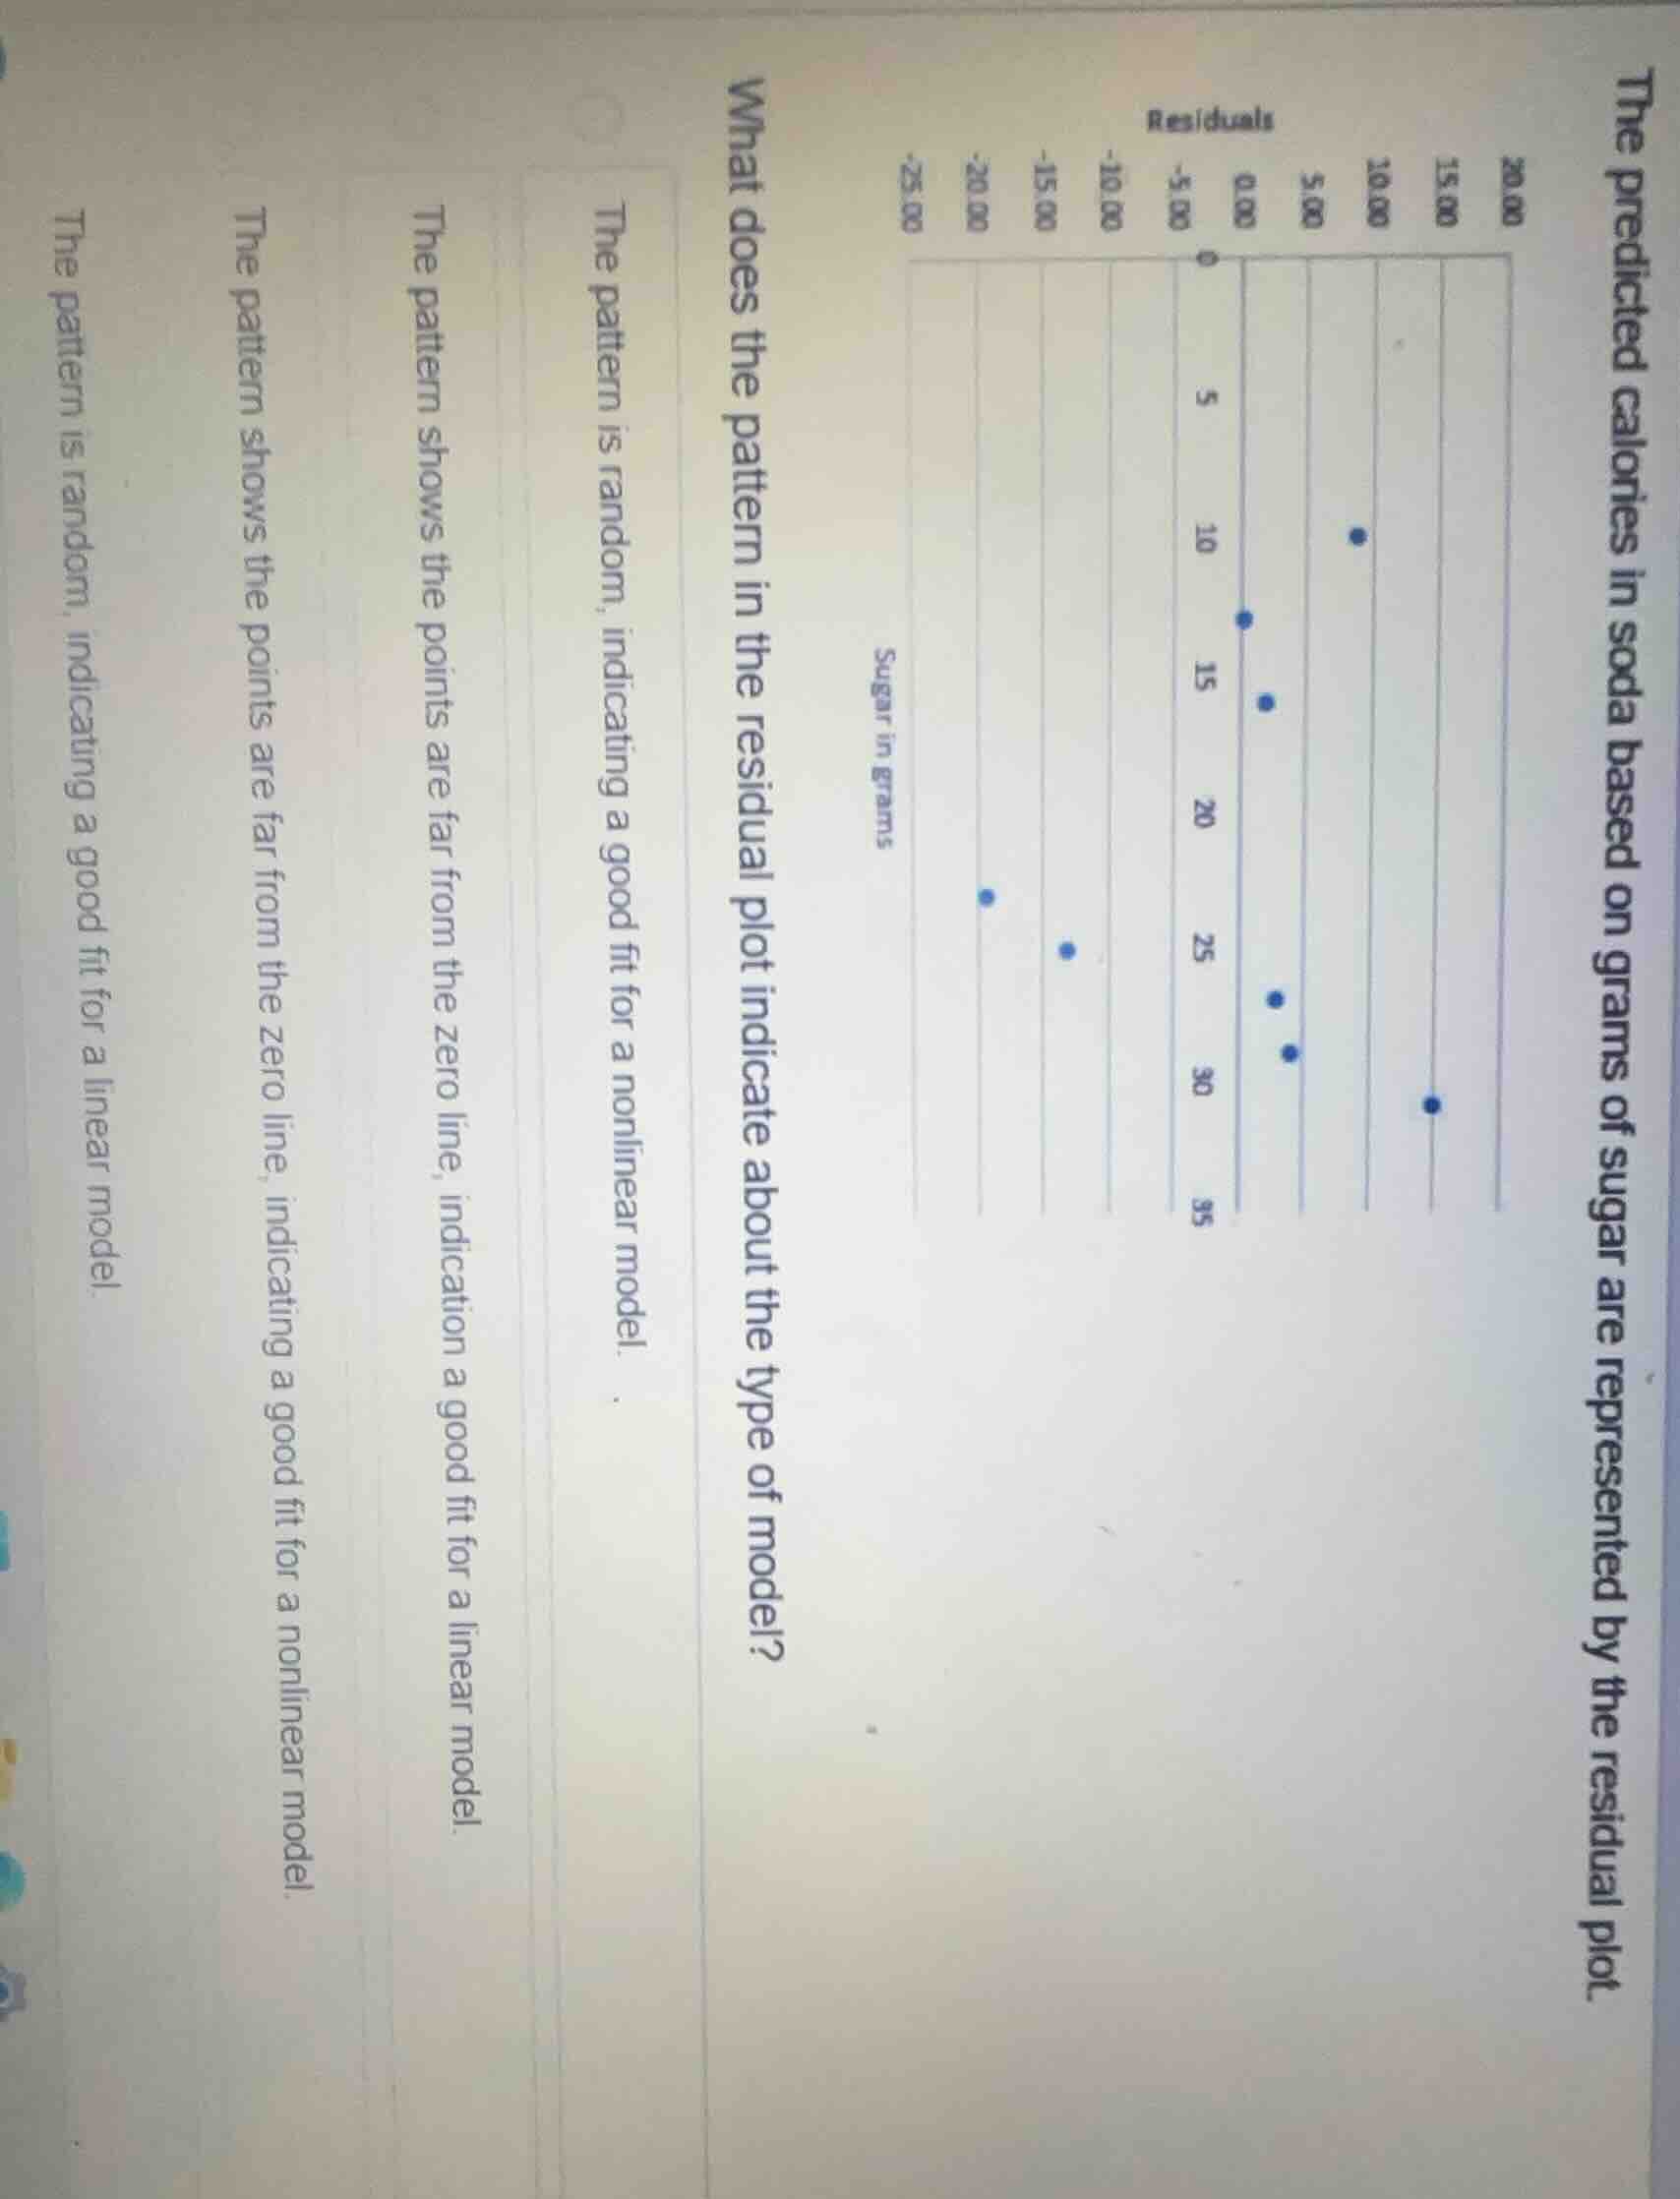
the predicted calories in soda based on grams of sugar are represented by the residual plot. what does the pattern in the residual plot indicate about the type of model? the pattern is random, indicating a good fit for a nonlinear model. the pattern shows the points are far from the zero line, indication a good fit for a linear model. the pattern shows the points are far from the zero line, indicating a good fit for a nonlinear model. the pattern is random, indicating a good fit for a linear model.
A residual plot with a random scattering of points around the zero line indicates that a linear model is appropriate, as it means the linear model captures the relationship between the variables and the remaining error is random. The given residual plot has points randomly distributed near the zero line, so it shows a good fit for a linear model.

Snap & solve any problem in the app
Get step-by-step solutions on Sovi AI
Photo-based solutions with guided steps
Explore more problems and detailed explanations
The pattern is random, indicating a good fit for a linear model.