QUESTION IMAGE
Question
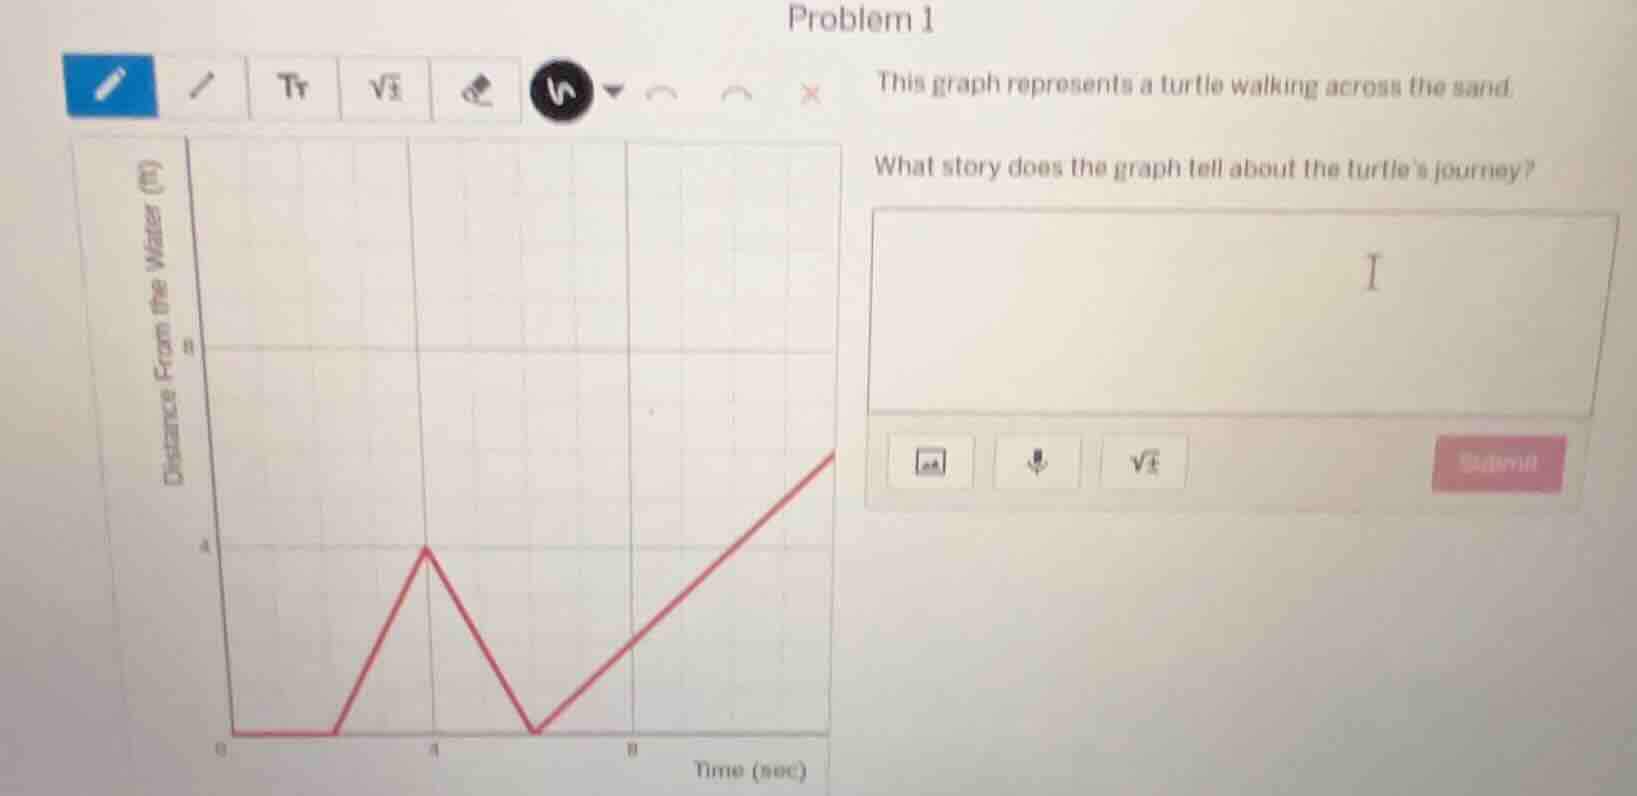
problem 1
this graph represents a turtle walking across the sand.
what story does the graph tell about the turtle’s journey?
graph with distance from the water (m) on y - axis and time (sec) on x - axis, red line plot: starts at (0,0), horizontal until some point, then rises to (4,4), falls back to (6,0), then rises again
The graph's x - axis is time (sec) and y - axis is distance from water (m). Initially, the turtle is at the water (distance 0) and stationary (flat line). Then it moves away from water, reaching 4m at 4 sec (increasing line). Next, it moves back towards water, reaching 0m at around 6 sec (decreasing line). After that, it moves away from water again, with distance increasing after 6 sec. So the story is: The turtle starts at the water's edge (distance 0) and is still for a while. Then it walks away from the water, reaching 4 meters from the water at 4 seconds. After that, it turns around and walks back toward the water, getting back to the water (0 meters from water) around 6 seconds. Then it starts walking away from the water again, moving further away as time goes on.

Snap & solve any problem in the app
Get step-by-step solutions on Sovi AI
Photo-based solutions with guided steps
Explore more problems and detailed explanations
The turtle starts at the water's edge (distance from water = 0 m) and is stationary for a short period. Then it walks away from the water, reaching 4 m from the water at 4 seconds. After that, it turns around and walks back toward the water, returning to the water (0 m from water) around 6 seconds. Then it begins walking away from the water again, moving farther from the water as time progresses.