QUESTION IMAGE
Question
problem solving
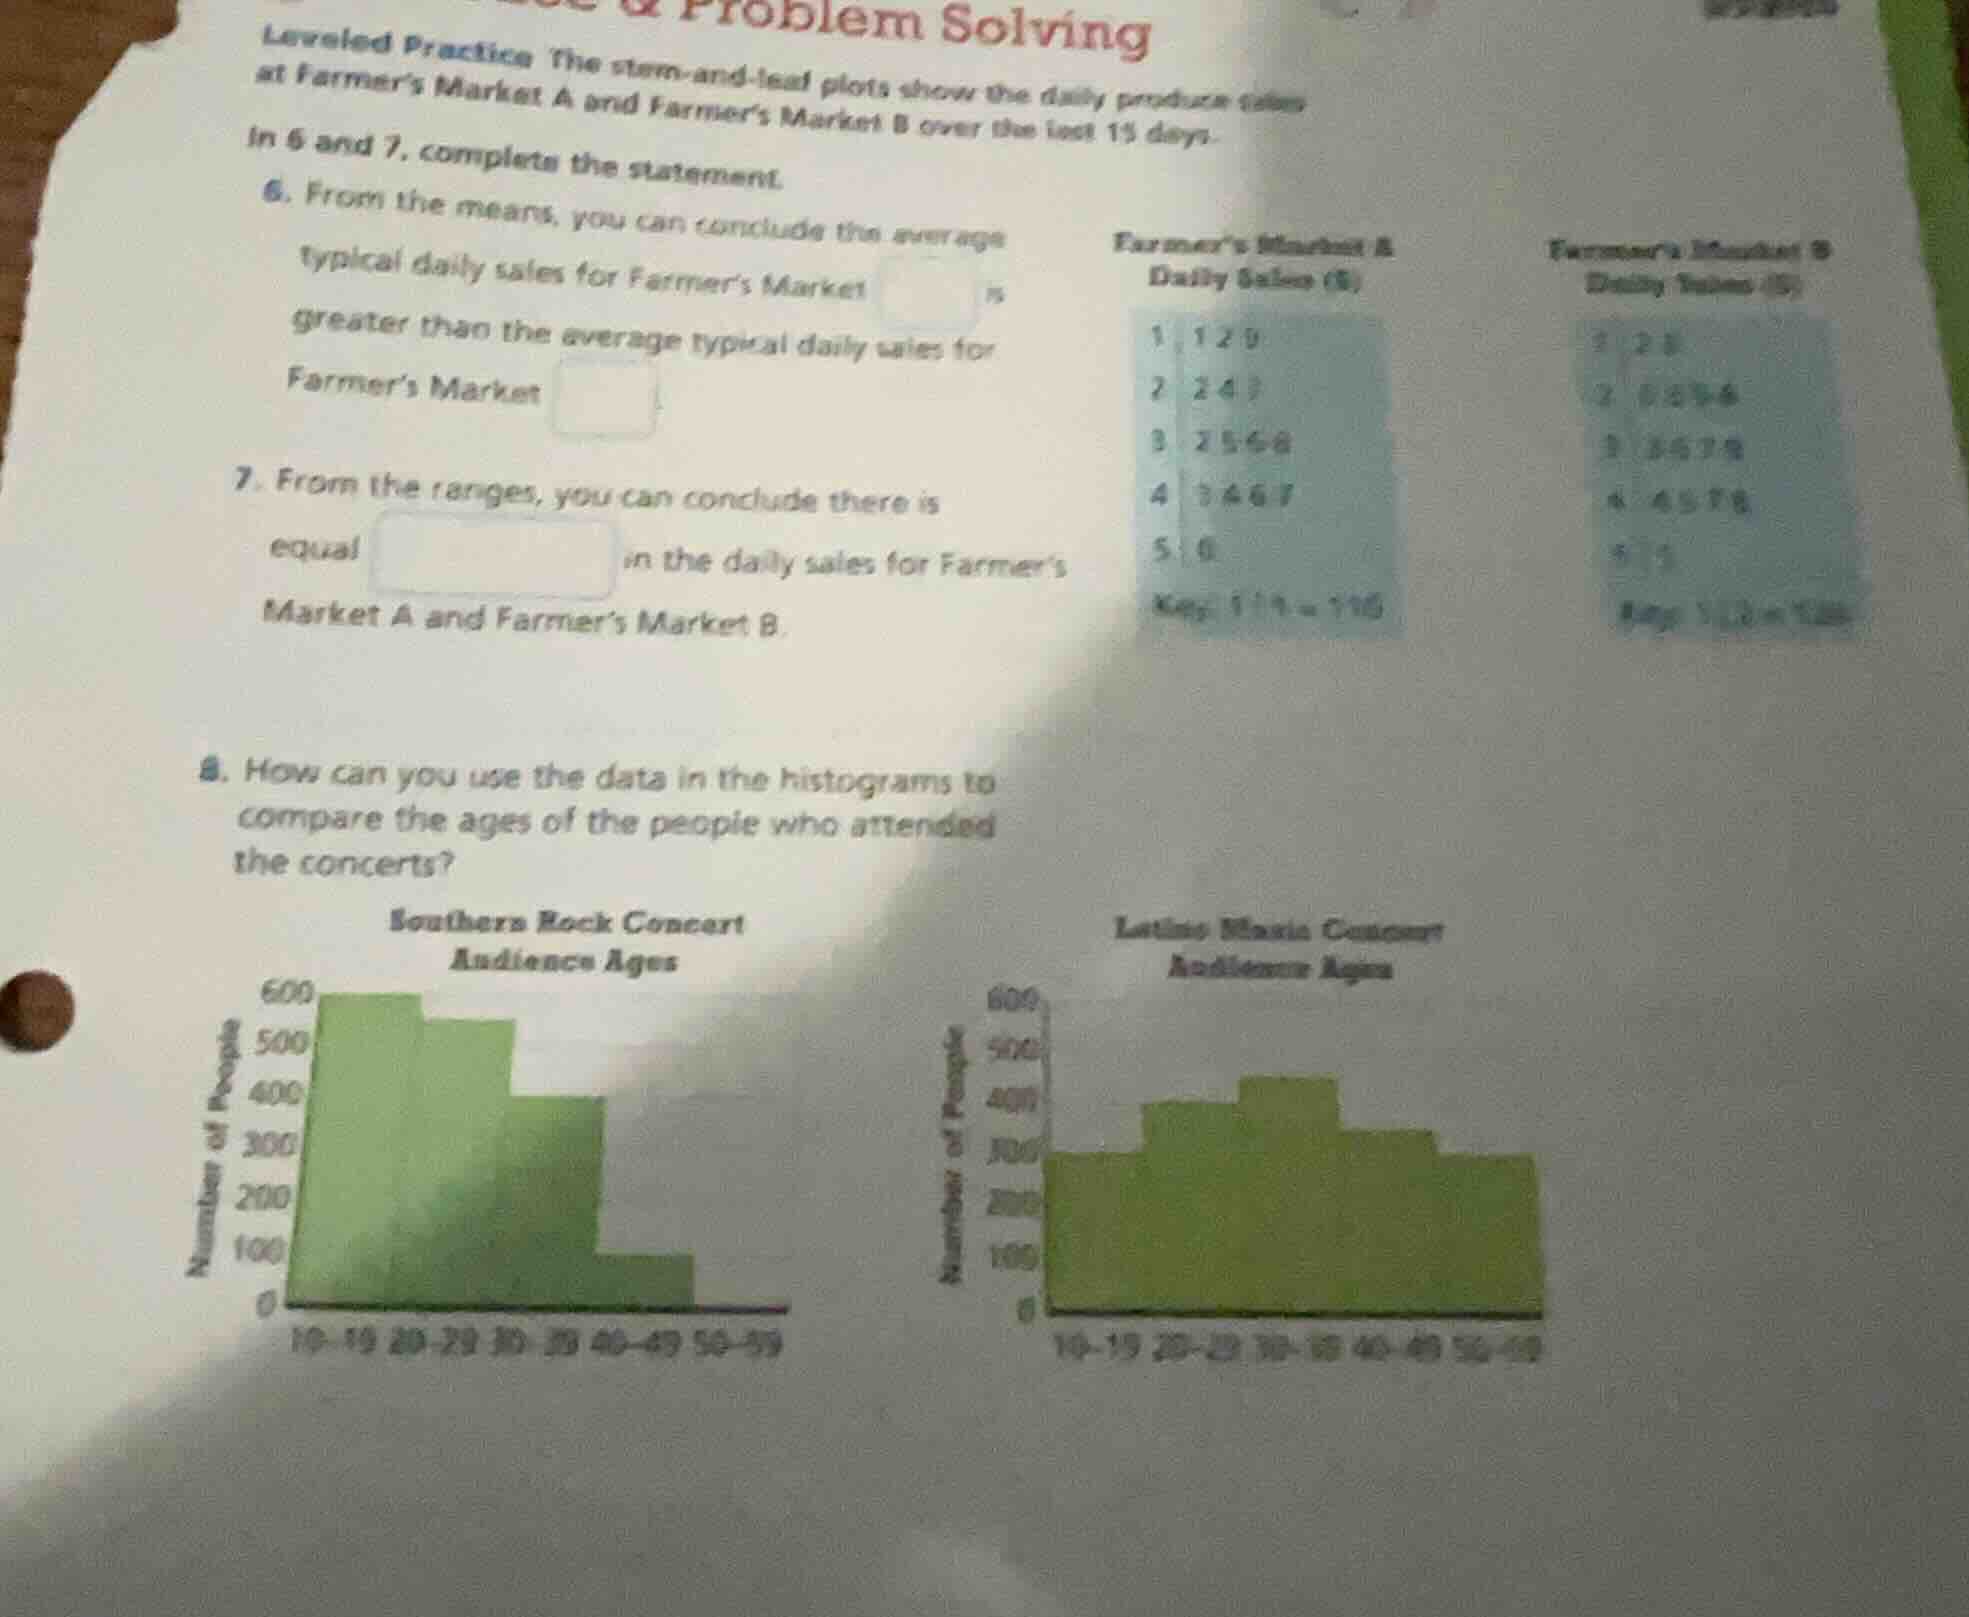
leveled practice the stem - and - leaf plots show the daily produce sales at farmer’s market a and farmer’s market b over the last 15 days.
in 6 and 7, complete the statement.
- from the means, you can conclude the average typical daily sales for farmer’s market
is greater than the average typical daily sales for farmer’s market
.
- from the ranges, you can conclude there is equal
in the daily sales for farmer’s market a and farmer’s market b.
- how can you use the data in the histograms to compare the ages of the people who attended the concerts?
Step1: List Market A sales values
From the stem-and-leaf plot (key: $1|1=110$):
$110, 120, 190, 220, 240, 270, 320, 350, 360, 380, 430, 440, 460, 470, 500$
Step2: Calculate Market A mean
Sum values, divide by 15:
$\text{Mean}_A = \frac{110+120+190+220+240+270+320+350+360+380+430+440+460+470+500}{15} = \frac{5260}{15} \approx 350.67$
Step3: List Market B sales values
From the stem-and-leaf plot (key: $1|2=120$):
$120, 180, 200, 260, 290, 240, 330, 360, 370, 380, 440, 450, 470, 480, 510$
Step4: Calculate Market B mean
Sum values, divide by 15:
$\text{Mean}_B = \frac{120+180+200+260+290+240+330+360+370+380+440+450+470+480+510}{15} = \frac{5460}{15} = 364$
Step5: Find ranges for both markets
Range = Max - Min
Market A: $500 - 110 = 390$
Market B: $510 - 120 = 390$
Step6: Analyze histograms
Compare peak age groups and distribution shape.

Snap & solve any problem in the app
Get step-by-step solutions on Sovi AI
Photo-based solutions with guided steps
Explore more problems and detailed explanations
- From the means, you can conclude the average typical daily sales for Farmer's Market $\boldsymbol{B}$ is greater than the average typical daily sales for Farmer's Market $\boldsymbol{A}$.
- From the ranges, you can conclude there is equal $\boldsymbol{variability/range}$ in the daily sales for Farmer's Market A and Farmer's Market B.
- You can compare the histograms by:
- Identifying the most common (peak) age groups: the Southern Rock Concert has the largest audience in the 10-19 age group, while the Latino Music Concert has the largest audience in the 30-39 age group.
- Observing distribution spread: the Southern Rock Concert audience is skewed toward younger ages, with numbers decreasing as age increases; the Latino Music Concert has a more evenly spread audience across all age groups, with no extreme drop-off in older age brackets.
- Comparing overall counts: the Southern Rock Concert has a larger total audience in its peak group than the Latino Music Concert's peak group.