QUESTION IMAGE
Question
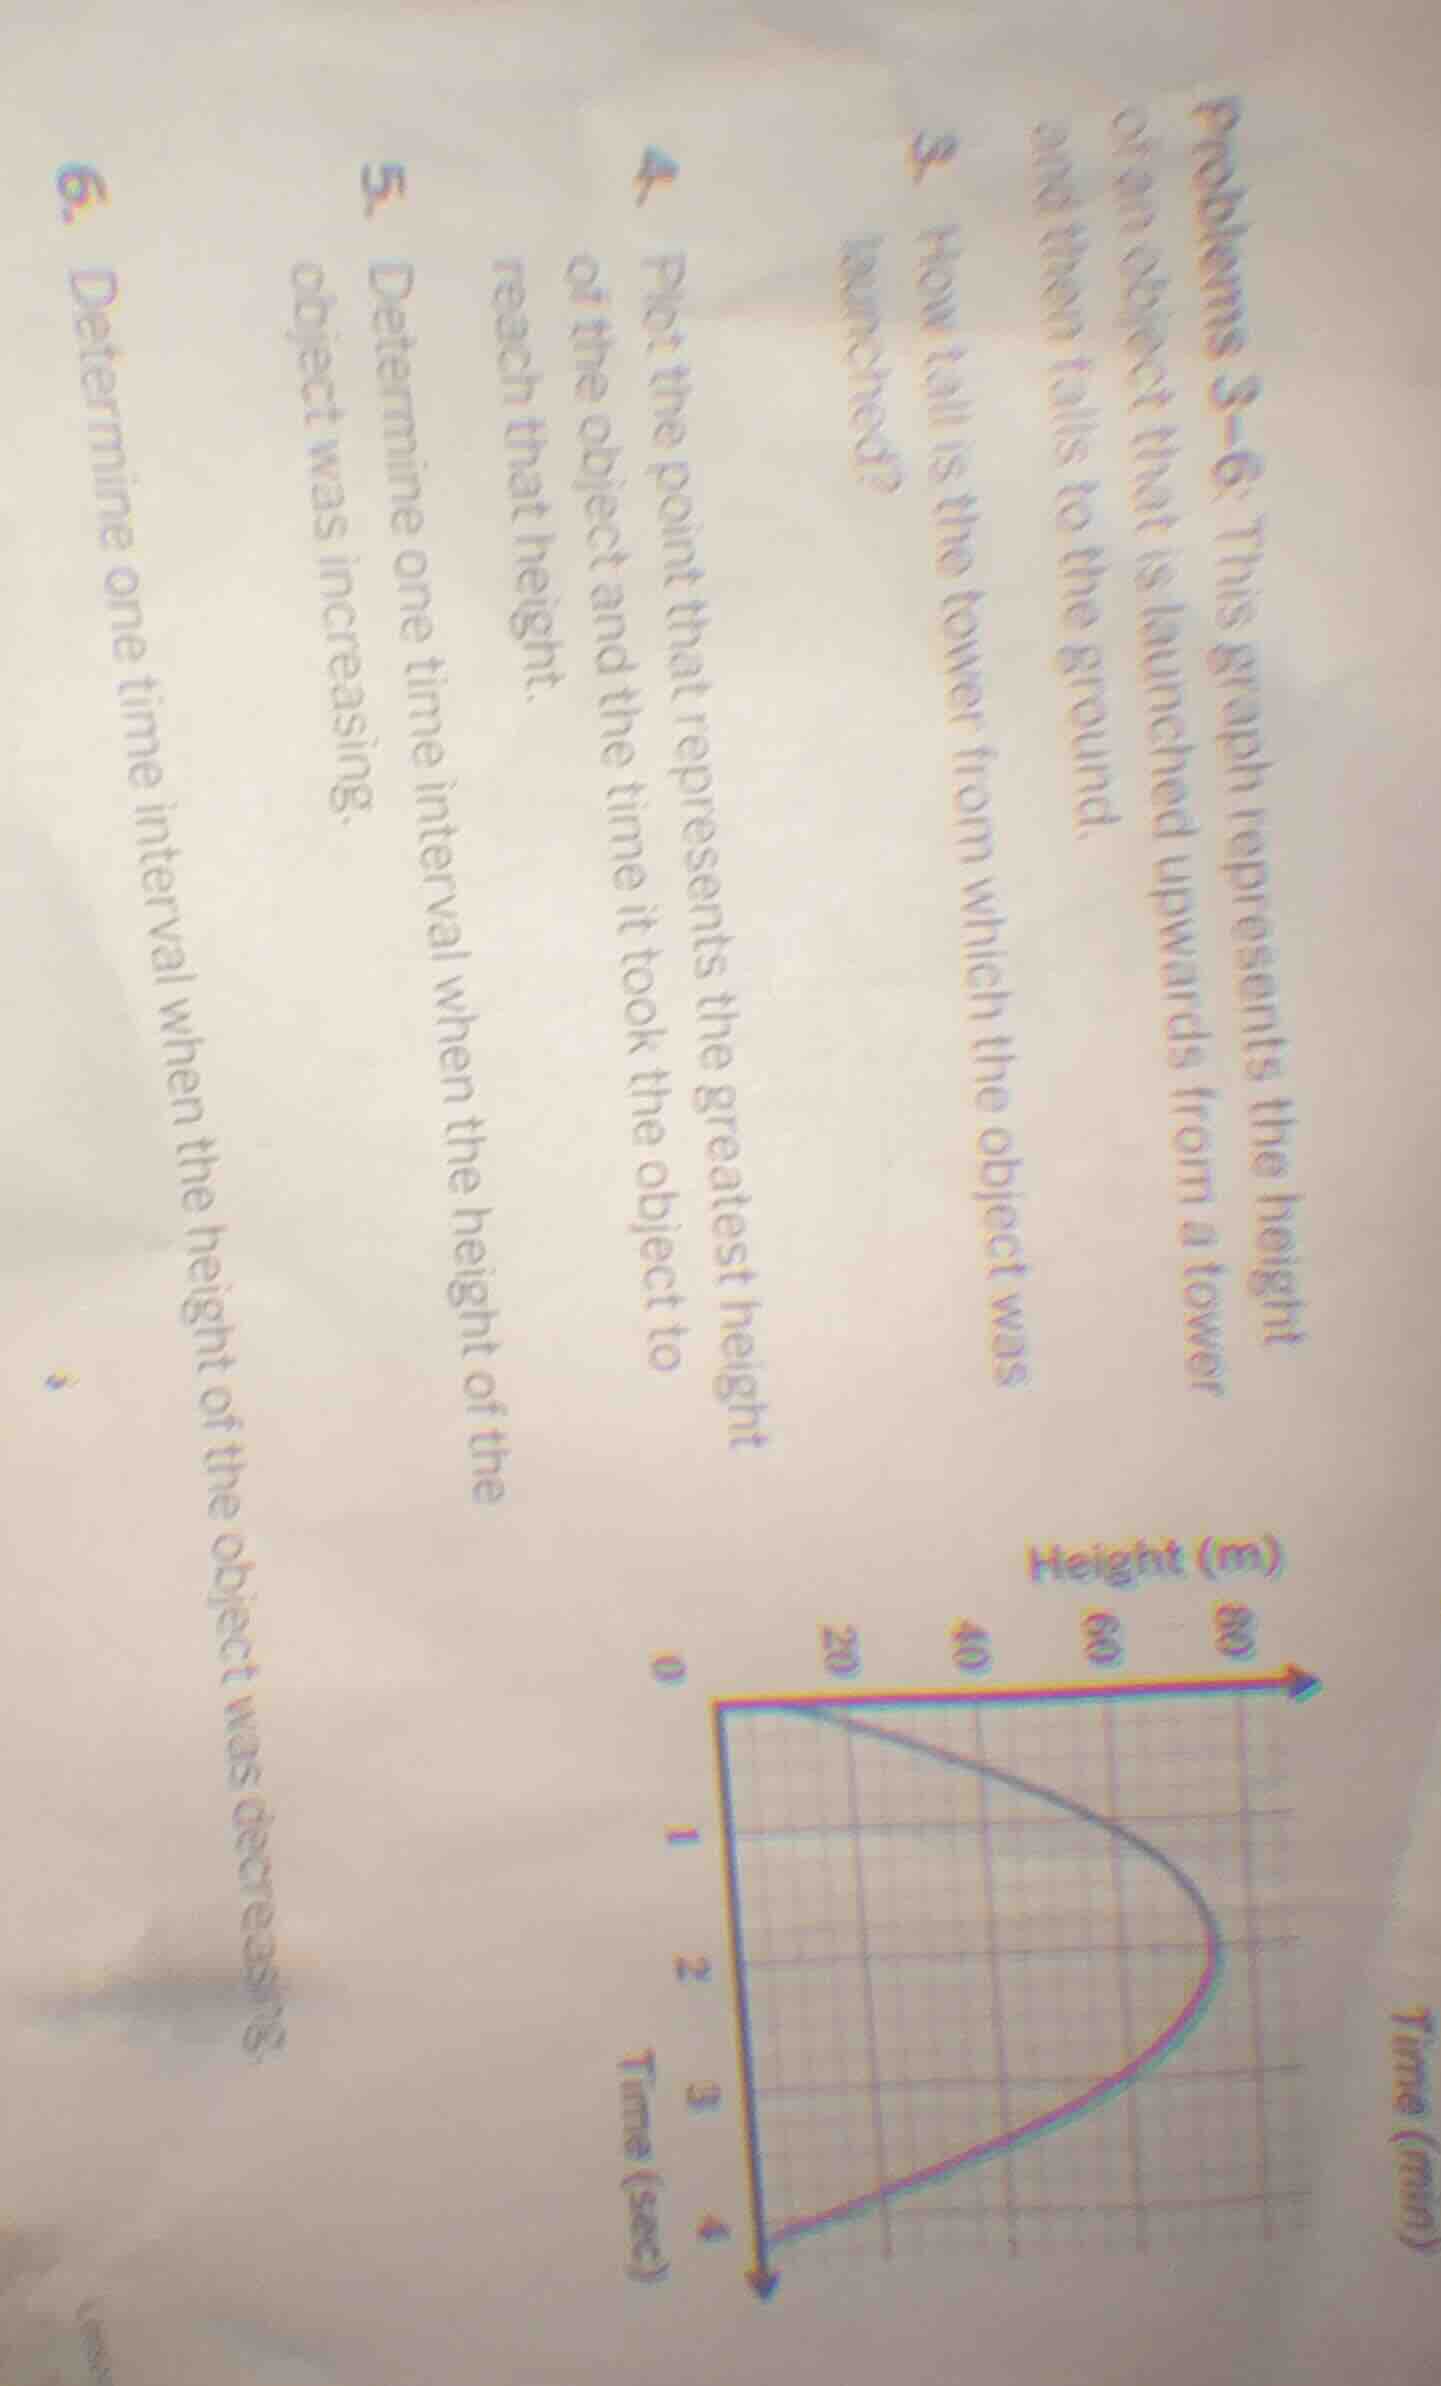
problems 3–6: this graph represents the height of an object that is launched upwards from a tower and then falls to the ground.
- how tall is the tower from which the object was launched?
- plot the point that represents the greatest height of the object and the time it took the object to reach that height.
- determine one time interval when the height of the object was increasing.
- determine one time interval when the height of the object was decreasing.
Step1: Identify initial height (tower height)
At $t=0$ sec, height $h=0$ ft? No, wait: At $t=0$, the object is at the tower's height. Looking at the graph, when time $t=0$, the height is $0$? No, correction: The y-axis is height (ft), x-axis time (sec). At $t=0$, the starting point is $(0, 0)$? No, no—wait, the object is launched from the tower. Wait, the graph starts at $(0,0)$? No, no, the leftmost point is $(0,0)$? No, the graph starts at (0,0), rises to (2,60), then falls to (4,0). Wait, no: At $t=0$, the height is the tower height. So at $t=0$, $h=0$? No, that can't be. Wait, no—when launched, the initial height is the tower height. The graph starts at $(0, 0)$? No, the left end is at (0,0), so the tower height is 0? No, no, wait: The object is launched upwards from the tower, so initial height (tower height) is the height at $t=0$. Looking at the graph, when $t=0$, height is $0$ ft? No, that would mean the tower is at ground level. Wait, no, the graph goes from (0,0) up to (2,60), then down to (4,0). Oh, right: At $t=0$, the object is at 0 ft? No, that's ground. Wait, no, the problem says "launched upwards from a tower and then falls to the ground". So when $t=4$, it hits ground (height 0). So at $t=0$, the height is the tower height. Looking at the graph, $t=0$ has height $0$? That can't be. Wait, no, I misread: The y-axis is height (ft), x-axis time (sec). The starting point is (0,0), peaks at (2,60), ends at (4,0). Oh, so the tower is at ground level? No, that doesn't make sense. Wait, no—maybe the tower height is 0? No, the problem says "launched from a tower". Wait, no, the graph shows that at $t=0$, height is 0, so the tower is 0 ft tall? That can't be. Wait, no, maybe I got the axes wrong. Wait, the x-axis is Time (sec), y-axis is Height (ft). The graph starts at (0,0), goes up to (2,60), then down to (4,0). So at launch ($t=0$), height is 0 ft. So the tower is 0 ft tall? That's odd, but that's what the graph shows.
Step2: Find max height point
The peak of the graph is at $t=2$ sec, $h=60$ ft. So the point is $(2, 60)$.
Step3: Identify increasing interval
The height increases from $t=0$ to $t=2$ sec, since the graph rises from (0,0) to (2,60).
Step4: Identify decreasing interval
The height decreases from $t=2$ to $t=4$ sec, since the graph falls from (2,60) to (4,0).

Snap & solve any problem in the app
Get step-by-step solutions on Sovi AI
Photo-based solutions with guided steps
Explore more problems and detailed explanations
- The tower is 0 feet tall (the object is launched from ground level, as shown by the height at $t=0$ being 0 ft).
- The point representing the greatest height is $(2, 60)$ (2 seconds after launch, at 60 feet).
- One time interval when height was increasing is $0 < t < 2$ seconds.
- One time interval when height was decreasing is $2 < t < 4$ seconds.