QUESTION IMAGE
Question
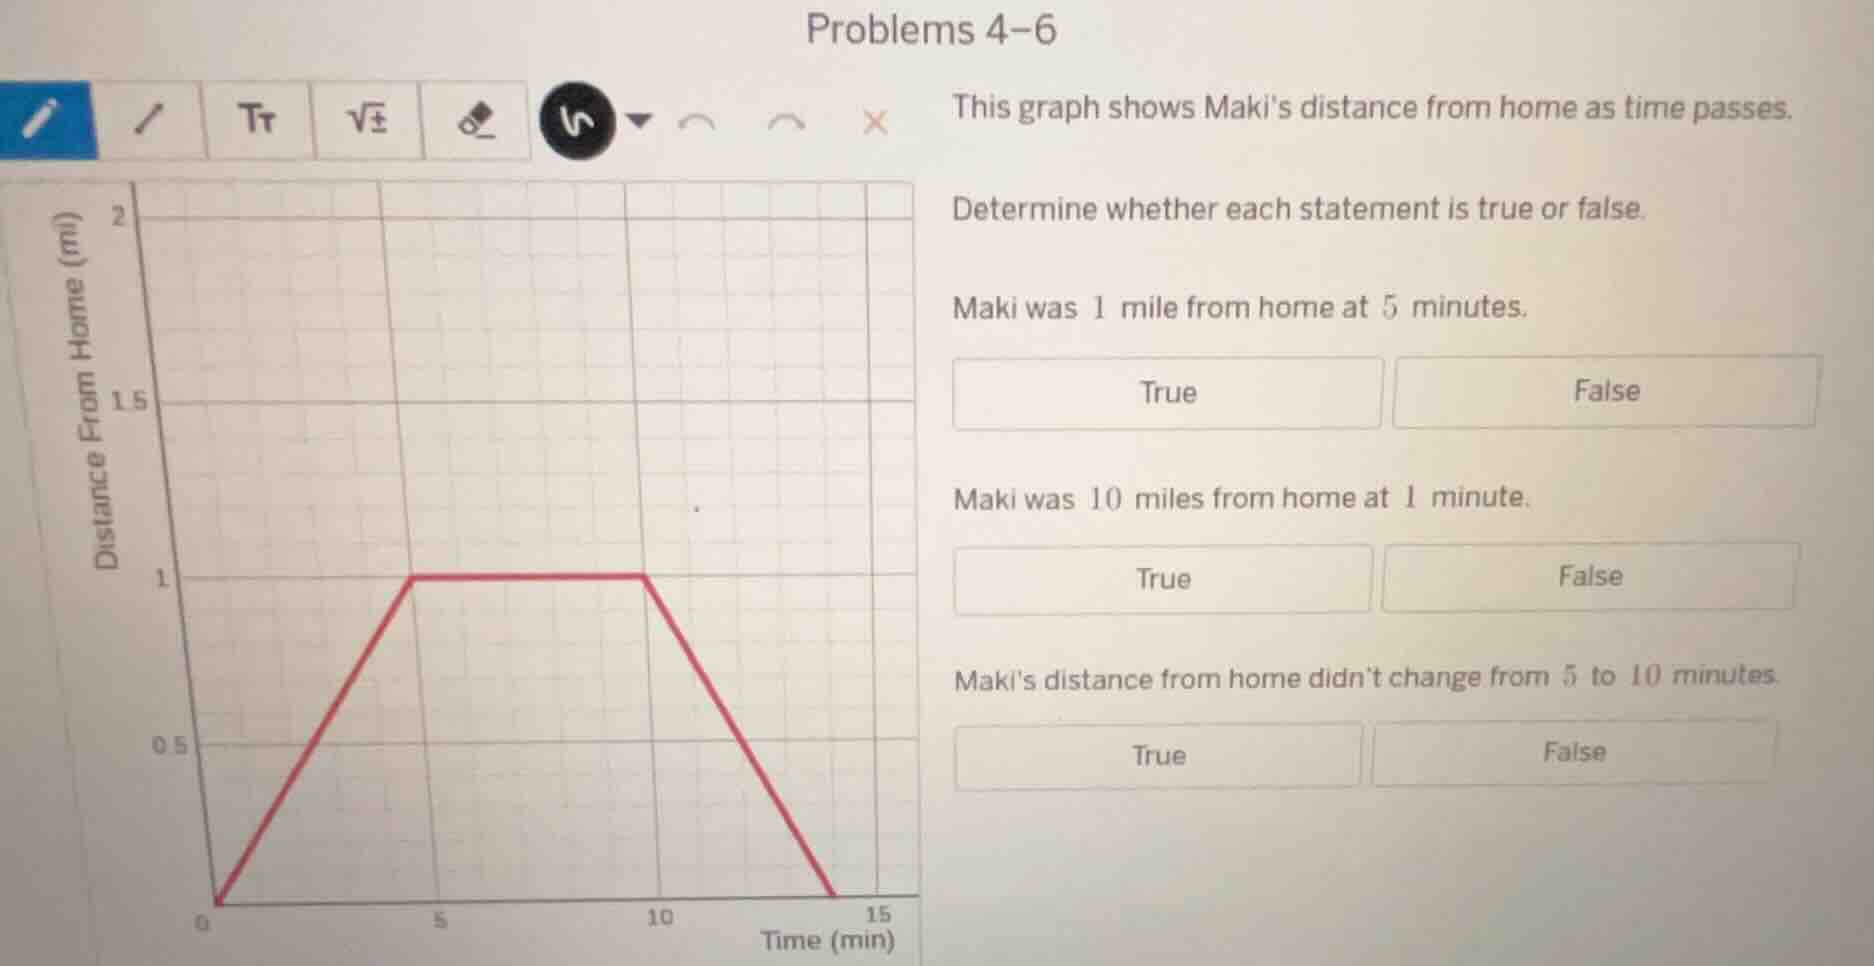
problems 4–6
this graph shows maki’s distance from home as time passes.
determine whether each statement is true or false.
maki was 1 mile from home at 5 minutes.
true false
maki was 10 miles from home at 1 minute.
true false
maki’s distance from home didn’t change from 5 to 10 minutes.
true false
Statement 1: Maki was 1 mile from home at 5 minutes.
Looking at the graph, at \( x = 5 \) minutes (time), the \( y \)-value (distance from home) is 1 mile. So the statement matches the graph.
From the graph, at \( x = 1 \) minute, the \( y \)-value (distance) is much less than 10 (it's on the line going up to 1 mile at 5 minutes, so at 1 minute it's a fraction of a mile, not 10). So the statement is incorrect.
From \( x = 5 \) to \( x = 10 \) minutes, the graph is a horizontal line (constant \( y \)-value), meaning distance from home stayed the same (1 mile). So the statement is correct.

Snap & solve any problem in the app
Get step-by-step solutions on Sovi AI
Photo-based solutions with guided steps
Explore more problems and detailed explanations
True